 English


Order Flow Trading Strategy: The Ultimate Guide
Using order flow analysis, you can see how other market participants are trading, whether they are buying or selling. Find out traded price volume using footprint patterns.
 5380
5380Selling the index futures and buying the underlying cash stocks constitutes the order flow trading strategy. It can generate large returns when carried out in large quantities.
Introduction
In order to understand the financial markets, there are a few types of technical analysis. Popular methods include momentum analysis, which uses mathematical indicators to analyze current market movements; fundamental bias analysis based on economics data releases key level analysis using daily pivots, daily highs, Fibonacci levels, and lows, etc.None of these very commonly used analysis types. Different scenarios are possible when price approaches a key level; it may reverse, review shortly before breaking the level, or it may falsely break the level.
There is one more aspect to order flow trading that is very unique; this is how strong the resistance may be at a given level. The idea behind price changes must be understood before we go further. There is an imbalance between the number of buyers and sellers that causes prices to move. The next quote tick is determined by this imbalance. Futures, commodities, bonds, stocks, options, and forex currencies all work with order flow strategy.
You'll learn how to acquire the mindset of a professional trader after studying the Order Flow Trading Strategy guide. You are at the right place if you're looking to learn how to trade using one of the oldest trading methods used by day traders. You'll learn one of the best order flow trading setups for trading market imbalances.
A trading candlestick price chart can help you gain a better understanding of what is going.When demand and supply are imbalanced, pricesmove. You, as a trader, are responsible for recognizing such imbalances. We'll help you identify price imbalances between the bids and ask prices in this order flow trading guide. Our first step will be to define order flow trading and how to take advantage of order flow chart trading.
What is order flow trading
Analyzing the flow of trading orders and their impact on prices to predict future price movements is referred to as order flow trading. In other words, the order flow analysis can give you an idea of what other market participants are buying or selling.
Tape reading or order flow analysis is other names for order flow trading. You can use order flow analysis to determine the final details of the volume of buying and selling. Candlestick analysis is a microscopic view of the market. Through order flow, it is possible to analyze theinformation contained within each candlestick.
As a whole, order flow trading can be compared to a volume-based trading system. You will be able to see how many buy and sell market orders were executed at each price level by using an order flow chart. You can determine the buyer and seller determined by looking at the Depth of the Market. As these buy and sell orders transform into market orders, they will be reflected on a price chart or footprint chart.
Precisely, we will explore two concepts, named as:
Trading order flow: how to do it.
The order flow and how to interpret it.
The numbers of orders waiting for the execution at the specific price level are referred as Order flow. It is certain that the price will eventually stop rising, even though it is rising steadily in a strong rally. Traders are simply more willing to buy than they are to sell, which causes the rally up. Consequently, the price shifts upward as more buyers demand the supply, creating an imbalance between buyers and sellers. There will eventually be a price drive up to where the number of sellers exceeds the number of buyers. As a result, prices will fall as more sellers are competing with buyers.
This is a simple description of what happens on the macro and micro levels of the markets. This is what determines whether prices move upwards or downwards. You can interpret a chart of a moving price by interpreting the forces at play at different price levels. After the events, it is straightforward as it appears on the charts.
The order flow analysis is a unique trading analysis technique that can help you predict with a good degree of certainty where imbalances in orders will emerge at a future price level. You will have more certainty and precision when you enter a market using this method.
How to trade order flow?
All that said, the flow can also be used as a complement to any trading method that you can combine it with. In fact, it can be combined with any type of analysis due to the fact that it provides the layer of price reasoning which can be paired with something like momentum or fundamental reasoning standard deviation.
Charts make it easier to better understand about the order flow and its strategies. You can learn in depth about the trading through charts. It represents the overall story of buyers and sellers that where they are actually located.
No indicators are involved in the order flow trading. Looking into the trading charts representing the horizontal levels can clear your focus which is the cleanest and simplest way of analyzing the price action.
Trading with Limit Orders
Limit orders are orders to buy or sell below or above the market price. Your order will be executed once the market reaches the limit price you have set. The use of limit orders is preferred by traders who want to set a maximum price for opening or closing a position. Although slippage may occur, the price would improve despite it.
Limit orders have a major downside in that some trades may never be executed due to price fluctuations. However, if you are too strict with your entry price, you may find yourself out of the market more often but at the same time, you will have a better risk-reward ratio when you trigger your trade.
When the markets are unrestrained, traders should keep this in mind. The order flow trading strategy might not give the expected reaction when markets are highly liquidated, such as during economic events or major surprises. In risk management stop losses have a significant place.
Order Flow Buy Limit

Order Flow Sell Limit

We look for trading areas or price levels in technical analysis. With the order flow analysis, we are looking for clues as to when to trade and at what price.
We can use order flow to gain insight into:
Market price can be driven by big buy and sell orders.
Buy-and-sell momentum.
Liquidity flow for Small, medium, or large buy and sell orders.
It is possible for prices to reverse when momentum exhausts (when order flow is drying off).
Terminate hunting.
A trapped buyer and a trapped seller.
Order flow trading tools: Footprint charts pattern?
The footprint pattern of a trading strategy is a graphical representation of the traded volume. Each price level in the pattern shows the volume. In real time, Footprints can tell traders three things: price volume at each price level, overflow or aggression of market traders.
We will add the horizontal volume profile to the aggregated orders, which will allow us to visualize the total number of buy and sell orders traded at any given price. In the volume profile, rectangles of various lengths will be displayed.

We can now see the buyers and sellers in the market with the footprint chart. We can see where the buyers and sellers are in control of the markets by tracking what is happening behind the crypto currency candlestick charts.
Using order flow trading, you can trade the P pattern as your first footprint pattern.
The following questions may be on your mind:
A P pattern describes the flow of orders.
In its simplest form, the P pattern is characterized by a narrow volume profile on the lower half of the candlestick, accompanied by a wide volume profile on the upper half of the candlestick.
If the shadows on the P pattern are small and the candlestick is bullish, then this pattern is ideal.
Below is an order flow chart:

Order flow trading refers to the process by which sellers liquidate their positions. When the trend is bearish, this type of footprint pattern is most effective.
This order flow pattern shouldn't be traded if it develops in a bullish trend or range market.
You should learn the B pattern as the second type of order flow trading setup. It is the opposite of the P pattern.
In a B candlestick, the upper half has a narrow volume profile, while the lower half has a wider profile. Clearly, buyers are exiting their positions based on this order flow pattern. A footprint pattern of this type works best when prevailing trends are bearish.
Here is the order flow chart:

B and P patterns are both reversal trading setups that are based on order flow analysis.
Tools for Order Flow Trading

The footprint chart illustrates the level of buyer and seller aggression. The big inventory of orders can be compared to what the market is doing using this information.A market's current state is determined by the trail of transactions that have actually occurred, not by those which are advertised (aka limit orders), but could happen if a certain price is reached.
Order flow trading involves reacting to the actions of the markets, which are reflected in the daily volume traded.In essence, you see market orders on the footprint graph (all filled orders). We can use this to determine which is controlling the market by comparing the bid and ask volumes.
Order Flow Trading Strategy
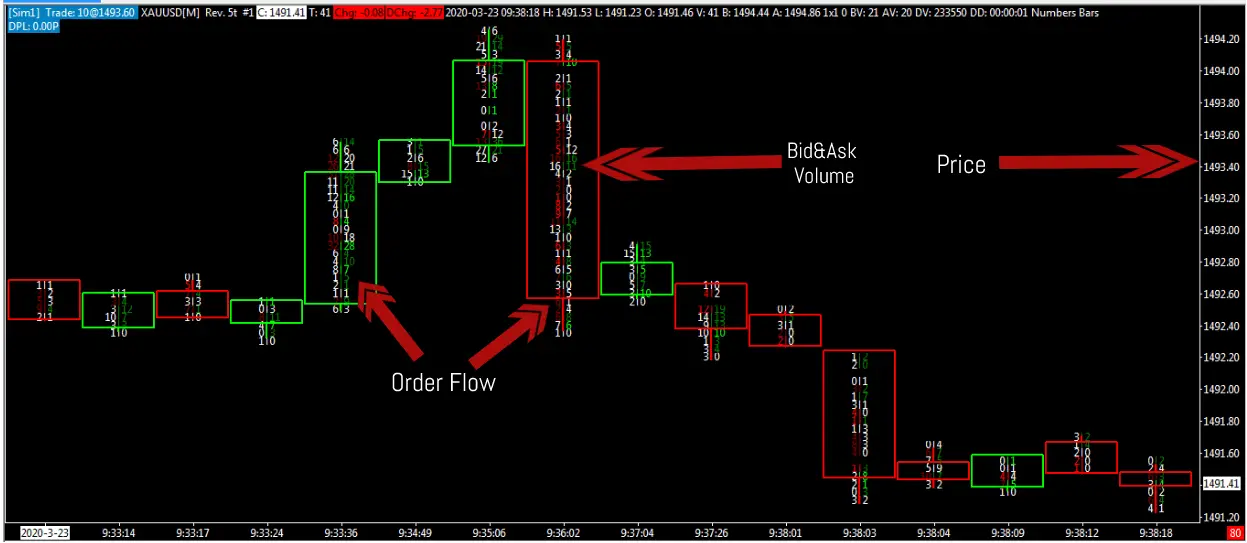
We are going to show you how the footprint chart works before we get into the details on how to use the order flow trading strategy. It is likely that you are asking how the Footprint Charts work now. You can develop a more comprehensive view of the market by using these charts. All the price and volume data are contained in the footprint charts. On the footprint chart, the volume traded at each price level is displayed for each bar and price level. Further, we will discuss some of the key concepts of how to trade order flow using footprint charts.
There are three pieces of information in each footprint chart:
A specific price is associated with each row of the footprint chart.
In the cell, you can see the bid-ask volume indicator.
Order flow (green shows aggressive buying, red shows aggressive selling).
Here is a chart of footprints:

The price at which the most traded volume on each footprint occurred is the point of control.
The footprint chart can be broken down into two parts:
Listed on the left are bids
On the right are the offers
The bid volume and the ask volume can be compared to build a picture of the relationship.To enter the market, you have to make a bid if you're an aggressive seller. Alternately, if you are an aggressive buyer and you don't want to wait for a limit order to be filled, you are going to lift the offer and hit the market order. The footprint chart will reflect this entire process.
Key concepts of footprint charts
Market demand and supply are visualized using footprint charts. In a similar way to the level 2 quotes of the past, footprint charts allow you to easily interpret order flow. Prices for securities depend on whether they are bought or sold. When you purchase something, you pay either the asking price or the offer price. If you are selling something, your price is called the bid.
Taking an offer or lifting the ask is considered to be taking the offer. Hitting the bid is the act of selling. We can now see the data that is actually interesting to us, namely executed orders, with footprint charts. Not the transactions on the trading DOM that are advertised to potentially trade.
Order flow trading imbalances
Recently, the term "order flow" has gained traction, as if newfound popularity has sprung up around one of the oldest market practices, a common-sense practice that has become infused with a secret that retail traders seek to uncover, believing it may give them an edge over other traders who do not have that knowledge.
The order flow in today's market
The old-school attitude might remain the same in today's markets, but the means, technologies, and laws governing order flow trading have changed. For an understanding of order flow, you must understand how depth of market and market orders play a dynamic role in the process.
A depth of market, or order book, shows the number of open buys and sells orders for a security at different prices. Let's say the current price is $1. If there are orders at $0.90, $1.10, etc., the DOM will show how many there are. It's an excellent tool for tracking where supply and demand are at.A market order involves trading stock for whatever the going price is at the time. When you place a limit order, you can specify a price and if the stock hits that price, the trade is usually executed.
An imbalance in order flow occurs when the market acts very aggressively. When we detect too much aggressiveness from either the buy-side or the sell-side, it is an aggressive initiative. In such an event, the market will often top out (bottom) after an aggressive move. To cause an imbalance in the order flow, you need a large increase in volume.
There are three rules you must follow when trading:
Order flow imbalances are used to trade in the direction of the imbalances looking for continuation patterns.
We will look for filling out the imbalance if it fails to move with the trend.
When we are able to move past the imbalance, we then search for reversal.
It is only when you can access a trade effectively and in the right time frame that you have a trade signal. Fortunately, footprints can help you with that.
Final words
The success of any trading method, analysis, or plan depends on the trader using it. Trading can be successful with the right analysis and the right mentality. Trading Order Flow, however, gives you a key advantage for trade execution. In order flow trading, you trade based on the bid and ask volumes of the markets, which have been traded. In addition to showing us the buy and sell imbalances, the order flow trading tools also show the timing of the execution.
Since the early 1900s, the order flow trading strategy has stood the test of time. While smart money usually tries to hide its tracks in the market, we believe we proved that order flow analysis can be used to follow the big money. You can benefit from order flow by using features such as High risk-reward ratio, Working the same with any timeframe, Good precision entry, and exit signals, A complementary method for almost any other trading technique, Perfect for Set & Forget trading approach, by predefined price levels using limit orders and easy to learn and understand what the market is doing.

Trending Articles
- Who Is Andrew Tate and Why Is He Famous? 10 Things to Know the Controversial Influencer
Discover who is Andrew Tate and why he's making waves in the digital sphere. Uncover 10 intriguing facts about this controversial influencer, his journey, and his impact on the online world.
2024-03-01 TOPONE Markets Analyst
 - Andrew Tate Net Worth 2024: Is the Internet's Most Controversial Man Worth $800 Million?
Explore the enigmatic Andrew Tate's net worth and delve into the controversies surrounding the internet's most polarizing figure. Is he truly worth $800 million? Uncover the truth behind his wealth and reputation here.
2024-02-23 TOPONE Markets Analyst - 20 Strongest Currencies in the World in 2024
Want to know the strongest currencies in the world in 2024? Here are the list for you!
2024-01-30 TOPONE Markets Analyst - Falling Wedge Pattern: The Ultimate Guide
A falling wedge is a bullish pattern characterized by a wide top and shrinking bottom. It is an extremely bullish pattern in a trading market.
2023-09-25 TOPONE Markets Analyst

 Bonus!

Bonus rebate to help investors grow in the trading world!
