English


Last Week's Performance Analysis
- Spot gold gained 122% in 16 hours!
- Earn 109% through WTI crude oil in 8.5 hours!
- Nasdaq opportunities are waiting for you to seize!
 Quantitative Indicator - USD (Super Trend)
· Gold
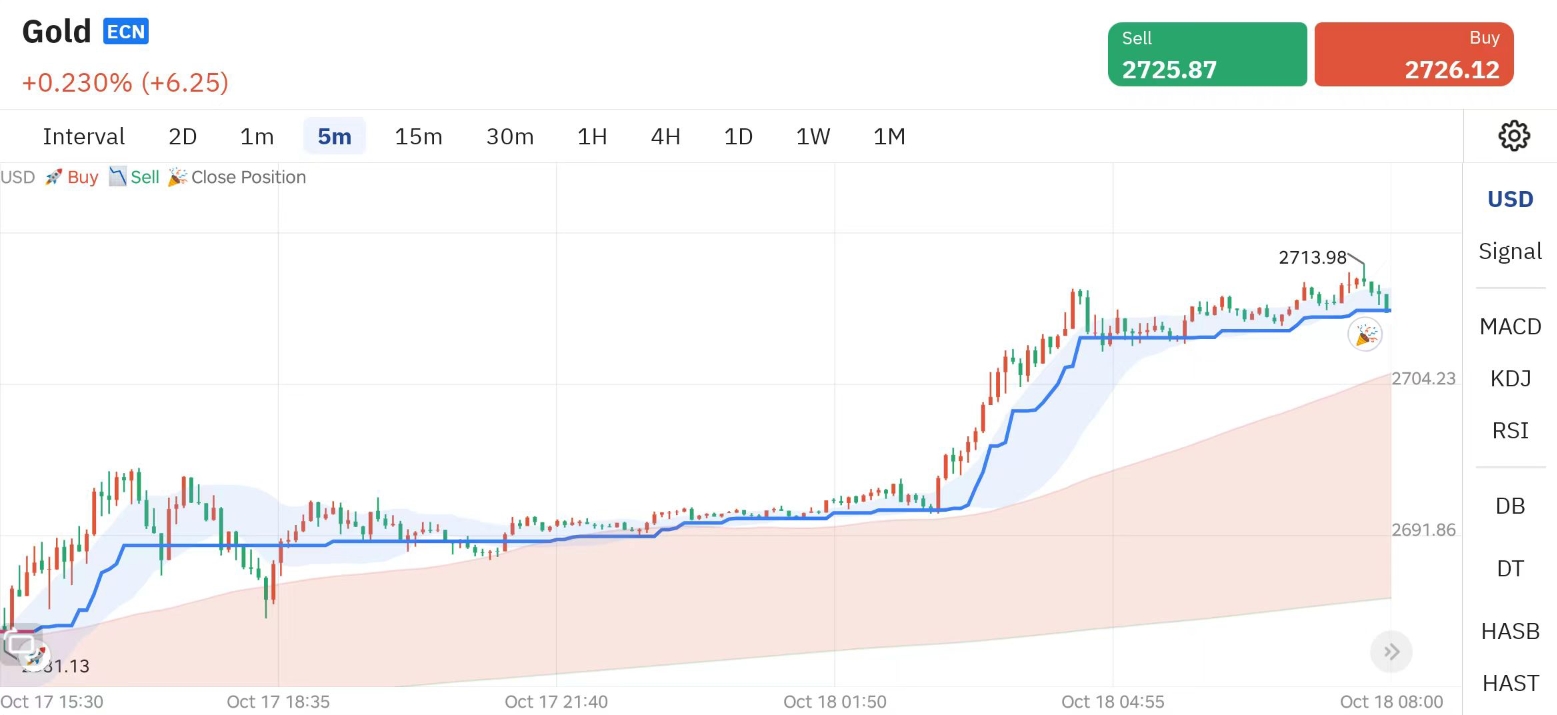
Gold (5-minute chart)
Last Thursday, October 17, at 15:35 pm, spot gold sent a 🚀 signal at 2681.13, which signaled that a wave of [bullish trend] was about to form. After that, the price continued to rise, and the upward trend continued until the 🎉 signal appeared at 2713.98 at 7:45 the next morning.
The whole process lasted only 16 hours. The super trend indicator [USD] brought us this wave of operations, with a point range span of 32.85 points.
Spot gold one-stop margin is $2681.13 & profit of 1 point is $100:
32.85*100/2681.13=122.52%
The profit margin reached 1.22 times, and the principal doubled again.
Intelligent pattern recognition· WTI Crude Oil
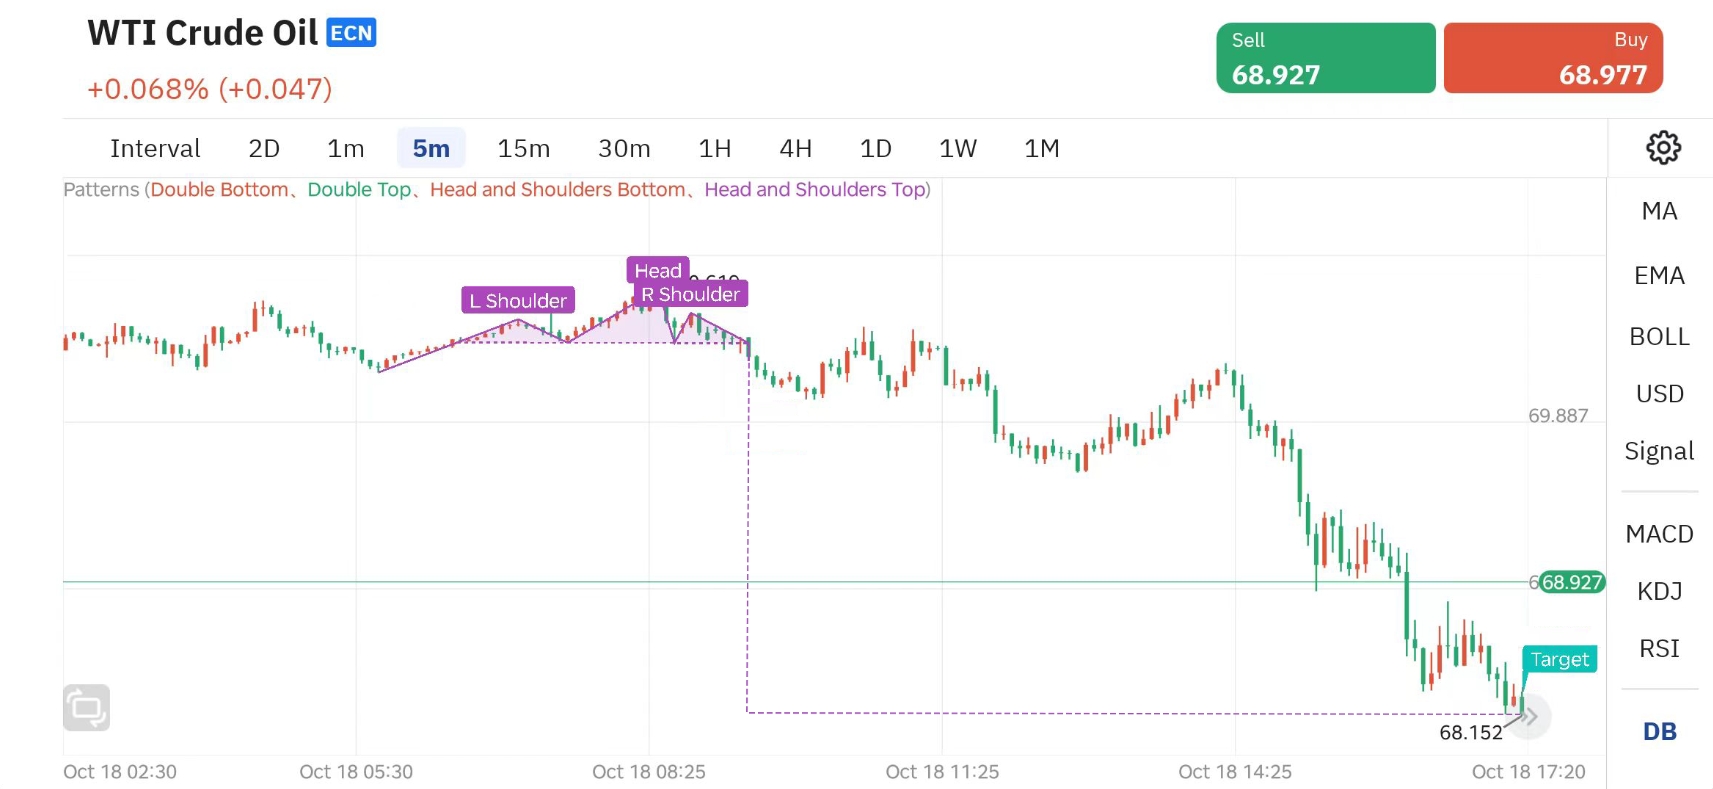
WTI crude oil (5-minute chart)
At 5:45 a.m. last Friday, October 18, WTI crude oil showed a wave of [head spire pattern] short-selling opportunities.
[1st Shoulder] formed at 7:10 in the morning, [Head] formed at 8:35, [2nd Shoulder] formed at 8:55 that morning, and [2nd Shoulder] formed at 8:55 in the morning. After that, it marks the establishment of the 【Head and Shoulders Top】.
If we choose to [short] at the [2nd shoulder] position at the price of 70.484, this downward trend can be held until 17:20 that afternoon. We will close the position when the system prompts [Target], and the closing price is 68.152.
From opening a position to closing the position, the entire market took only 8.5 hours. Through [Head Peak Form], our profit margin is 2.332 points.
Calculated based on the WTI crude oil contract margin of $2135.87 & profit of 0.001 points of $1
2.332*1000/2135=109.22%
The profit margin reached 1x return rate. The principal can be doubled directly.
Weekly Trending Product Analysis
Nasdaq 100
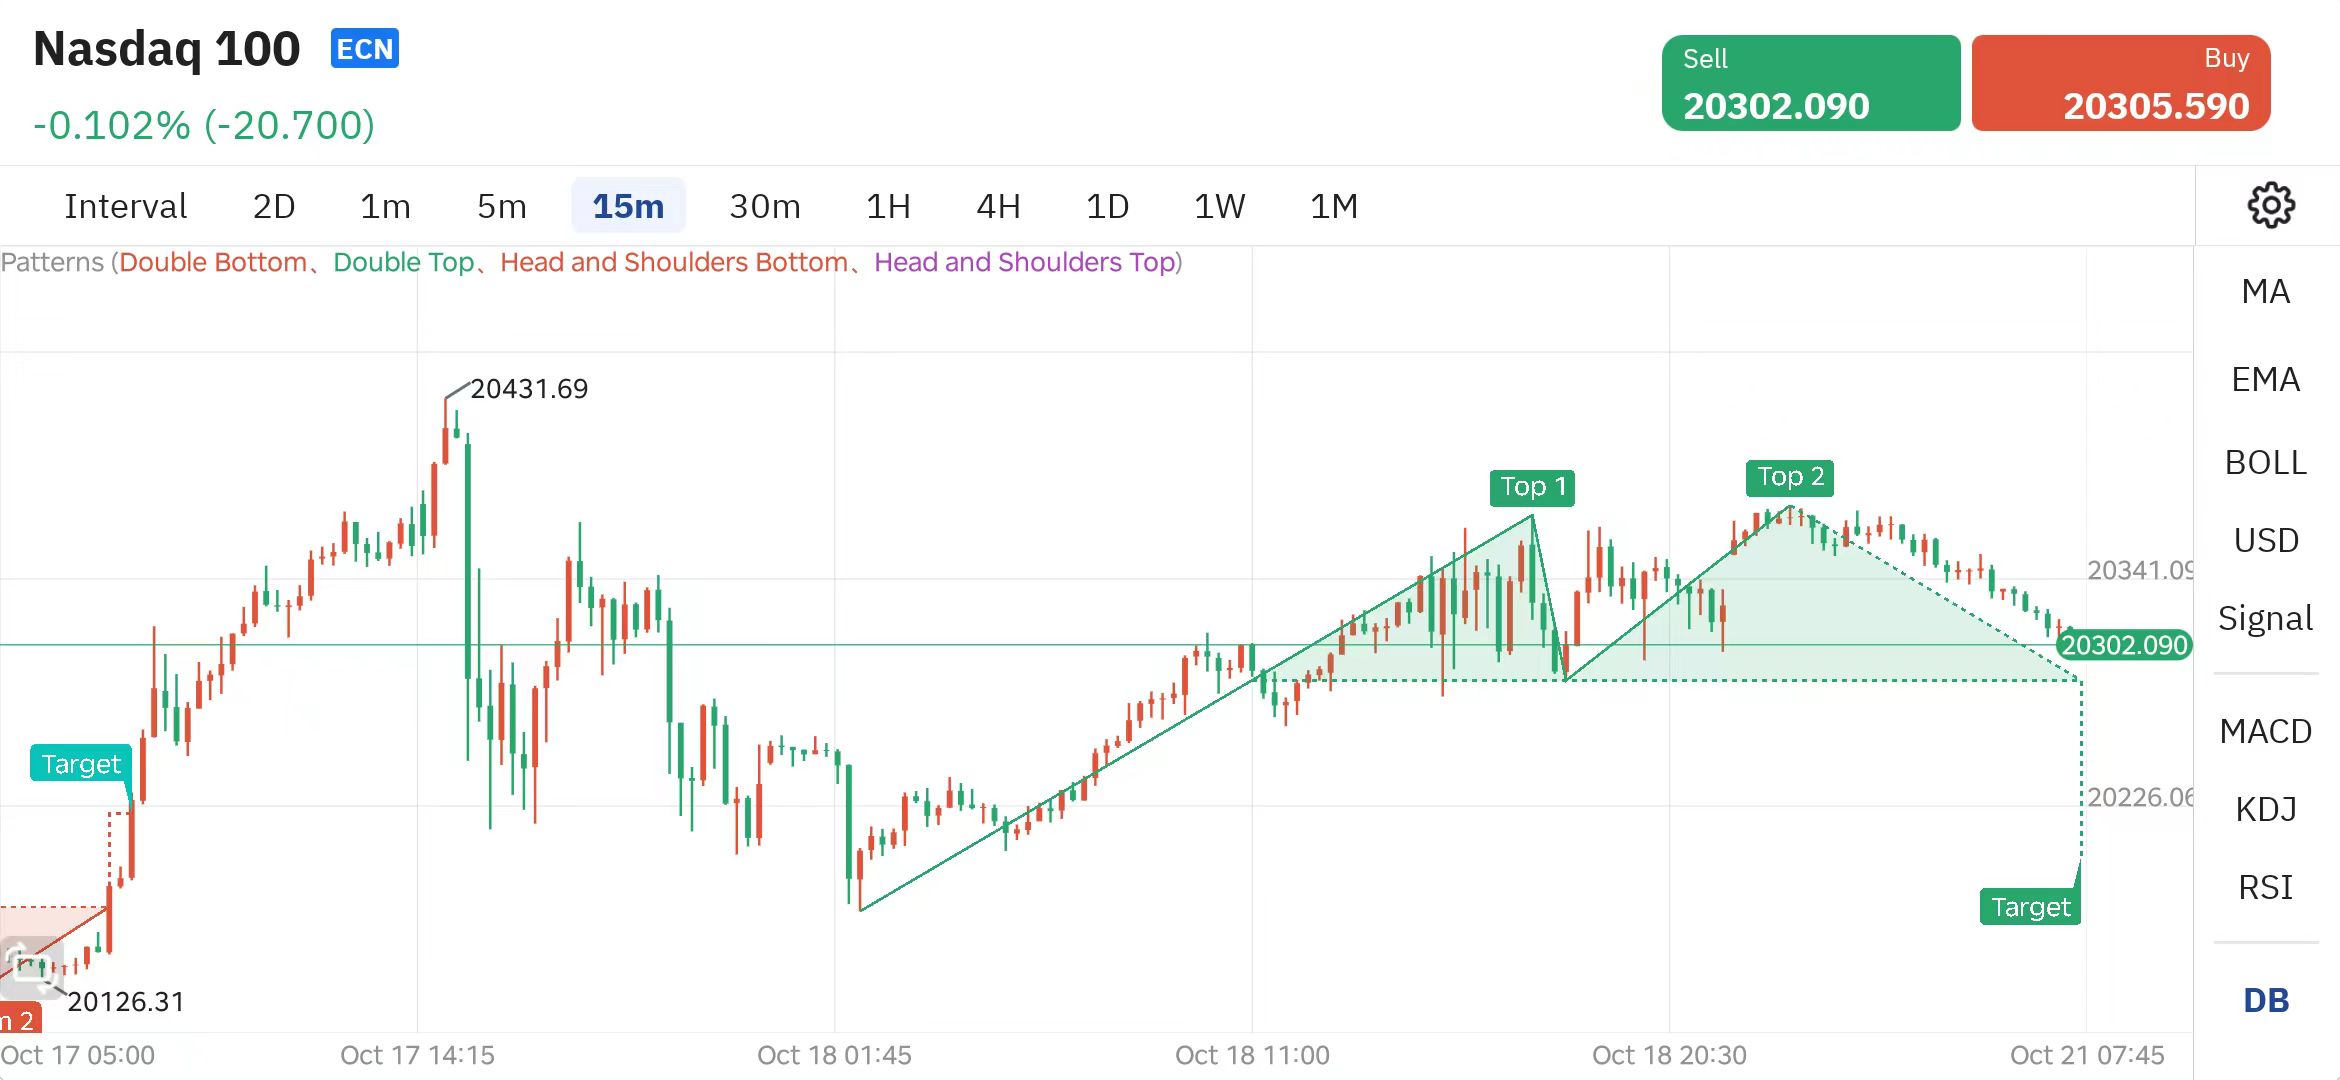
Nasdaq 100 (Daily Chart)
Judging from the 15-minute morphological chart of Nasdaq, the Nasdaq 100 has formed an obvious "double top" pattern, which indicates that short selling opportunities are about to appear. This is very similar to the signal that appeared at the beginning of October 8th.
The previous wave of decline of the Nasdaq 100 was also a 15-minute trend line, which also showed a "double top" pattern, but it brought a gain of up to 404%. So, how should we operate this double top pattern? When to open a position and when to close it? These problems can be judged through the signals of the intelligent assistant.
It should be reminded that for users who have not yet opened the signal, they need to conduct repeated simulations through a large number of models because the trend of short-term strategies changes extremely quickly. Once the conditions are not met, the system will automatically generate corresponding operation signals. Therefore, it is not recommended for friends who have not yet opened the signal to use this strategy. If you want to activate the signal, you can directly consult customer service to obtain the activation permission.
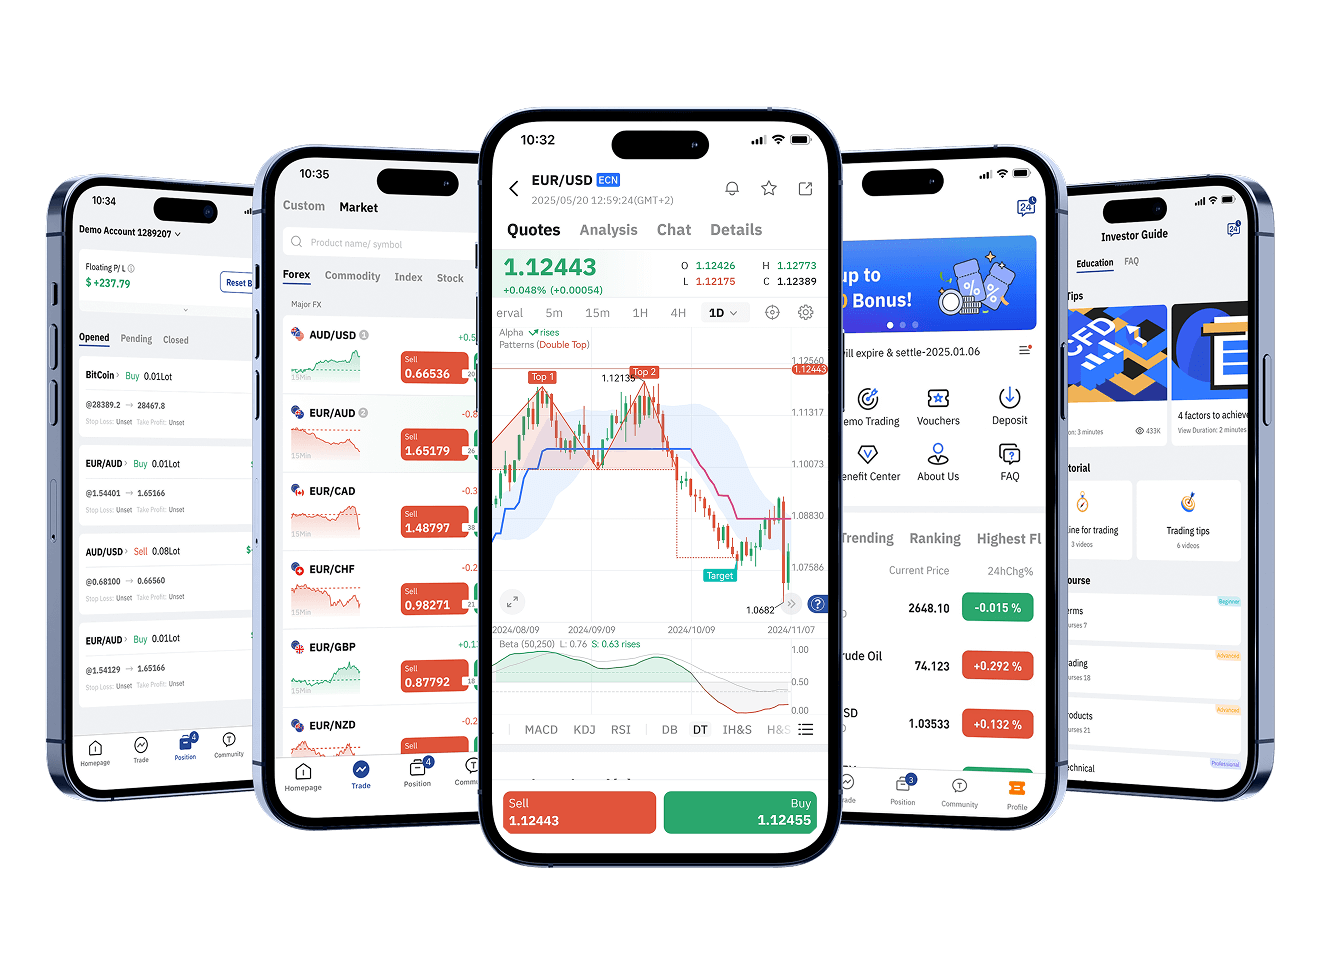
Download TOPONE Markets
Download TOPONE Markets
Get the most profitable trading signals first, 1 million traders have downloaded it, and the average daily profit opportunities exceed 200!