English


Last Week's Performance Analysis
- EUR/USD brings an amazing profit of 55% in 8 hours!
- In just 2 hours, your principal triples! Easily achieve investment profit.
- WTI crude oil shows a rare head and shoulders top, and the right shoulder is about to take shape. Seize the opportunity and act now!
 Quantitative Indicator - USD (Super Trend)
· EUR/USD
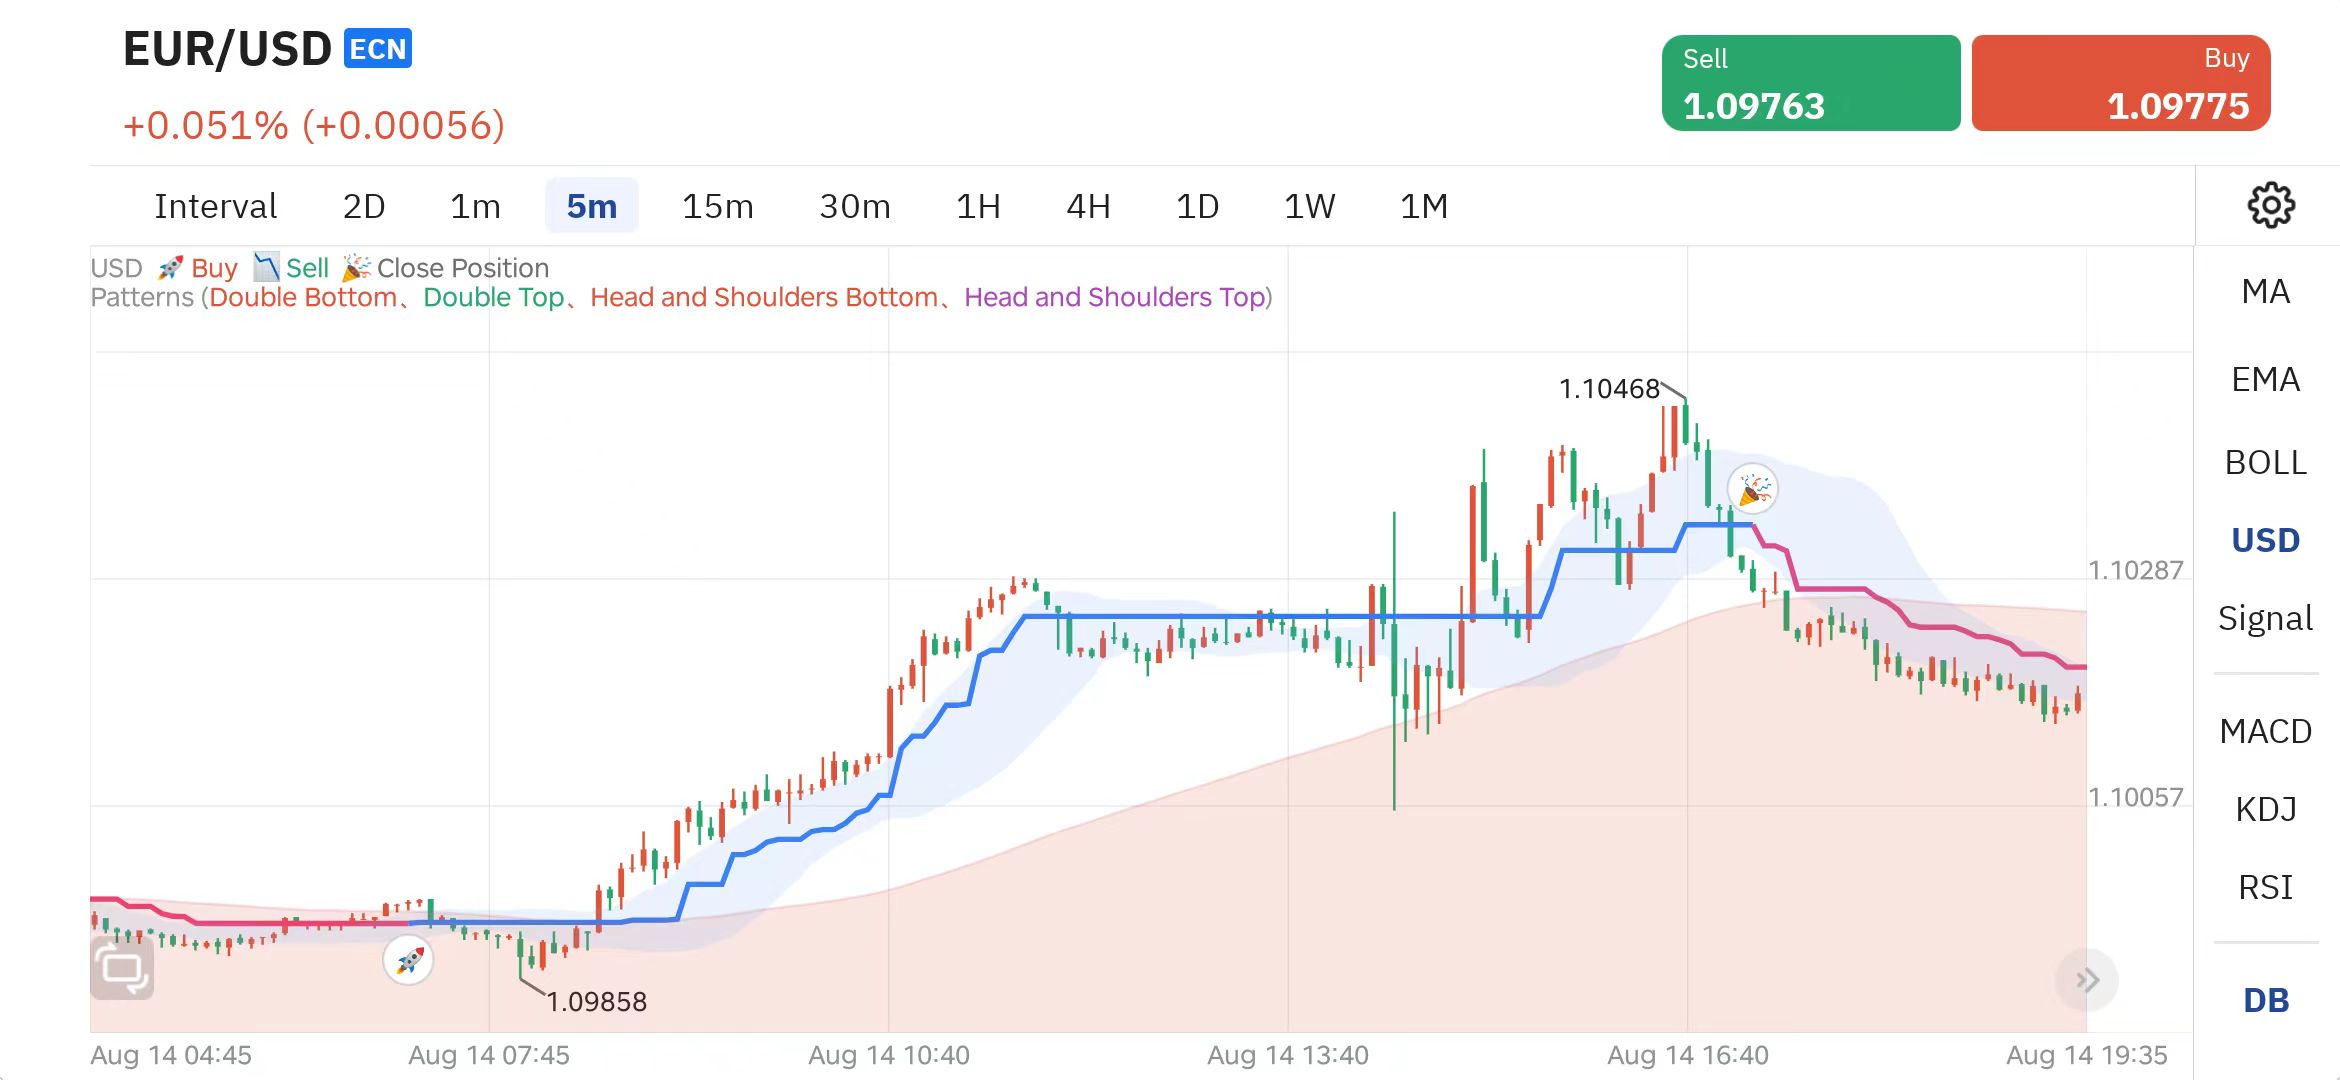
EUR/USD (5-minute chart)
At 8:00 am on Wednesday, August 14, the software issued a 🚀 signal at 1.09858 in the EUR/USD product, which indicated that a wave of [bullish trend] was about to form. The upward trend continued until 16:40 that afternoon, and the 🎉 signal ended at 1.10468.
In nearly 8 and a half hours, the super trend indicator [USD] brought us an operating range of up to 610 points. The profit margin reached 55.25%.
Intelligent pattern recognition· BTC
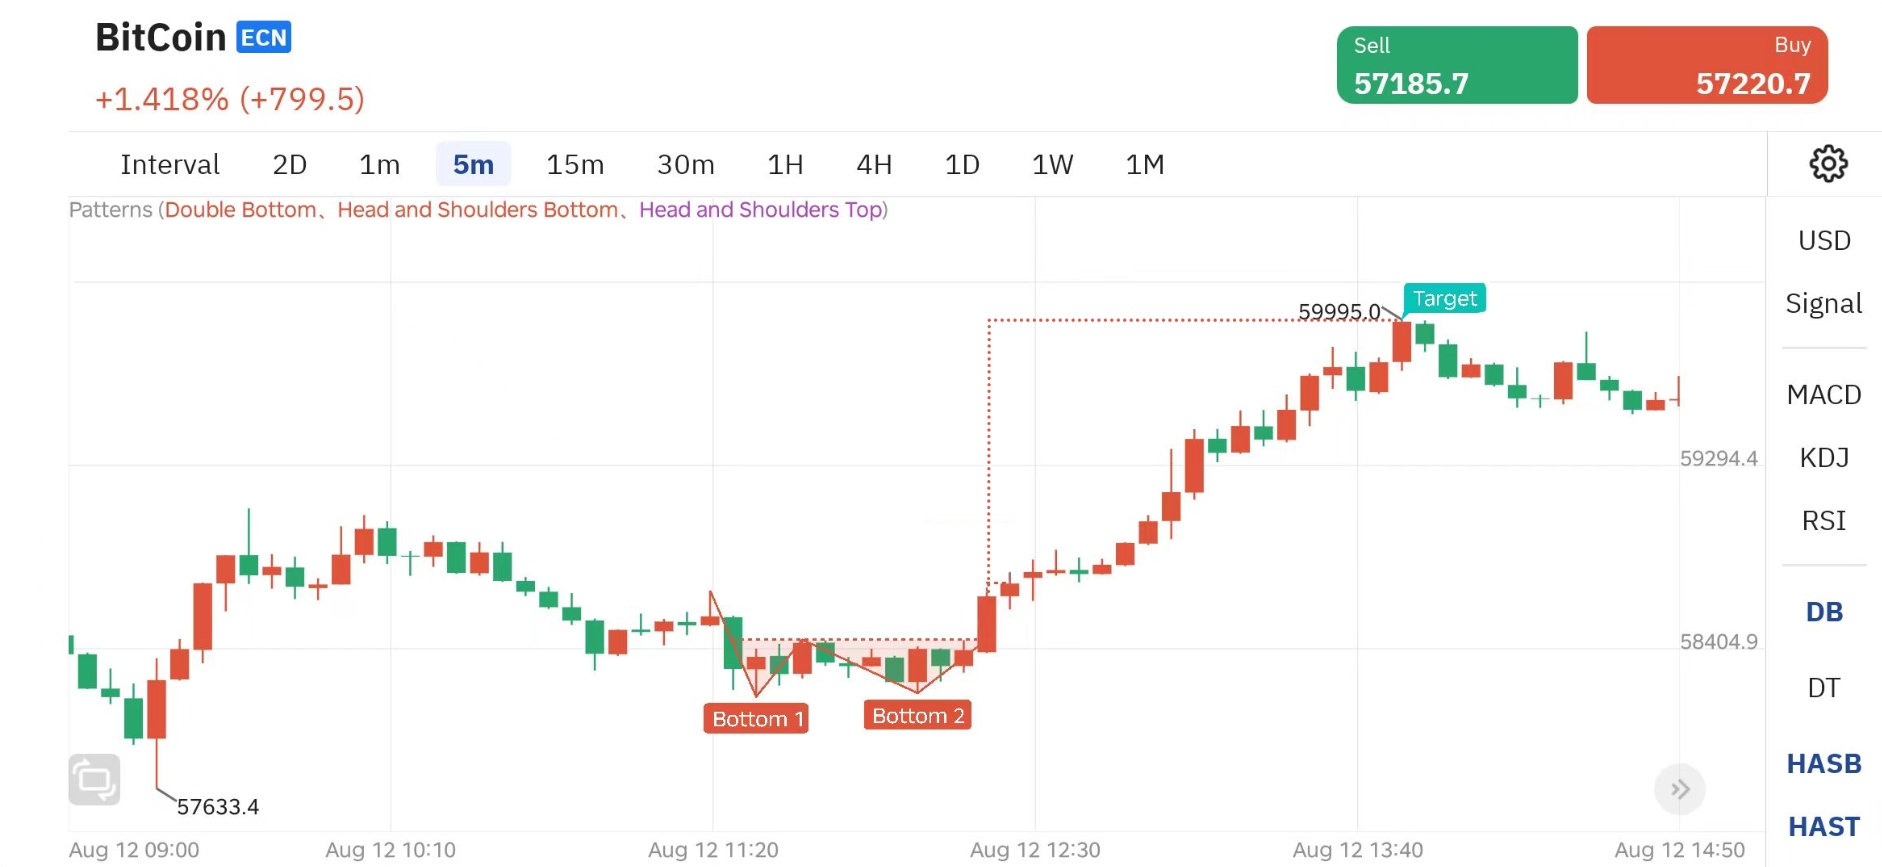
BTC (5-minute chart)
The appearance of the [double bottom pattern] started at 11:20 on August 12, last Monday.
10 minutes later, at 11:30, we observed the formation of the first bottom. Then, 35 minutes later, at 12:05, the second bottom was also formed, which marked the establishment of the double bottom pattern. If we choose to go long at the second bottom at 58113.7, this wave of market can be held until 13:50 at noon that day. We wait until the system prompts [Target] before closing the position, and the closing price is 59995.0.
Then, it only takes 1 hour and 50 minutes from entering the position to closing the position. Through the signal of the double bottom pattern, we have a profit margin of 18853. The profit margin is as high as 321.39%, and the principal is tripled.
Weekly Trending Product Analysis
WTI Crude Oil
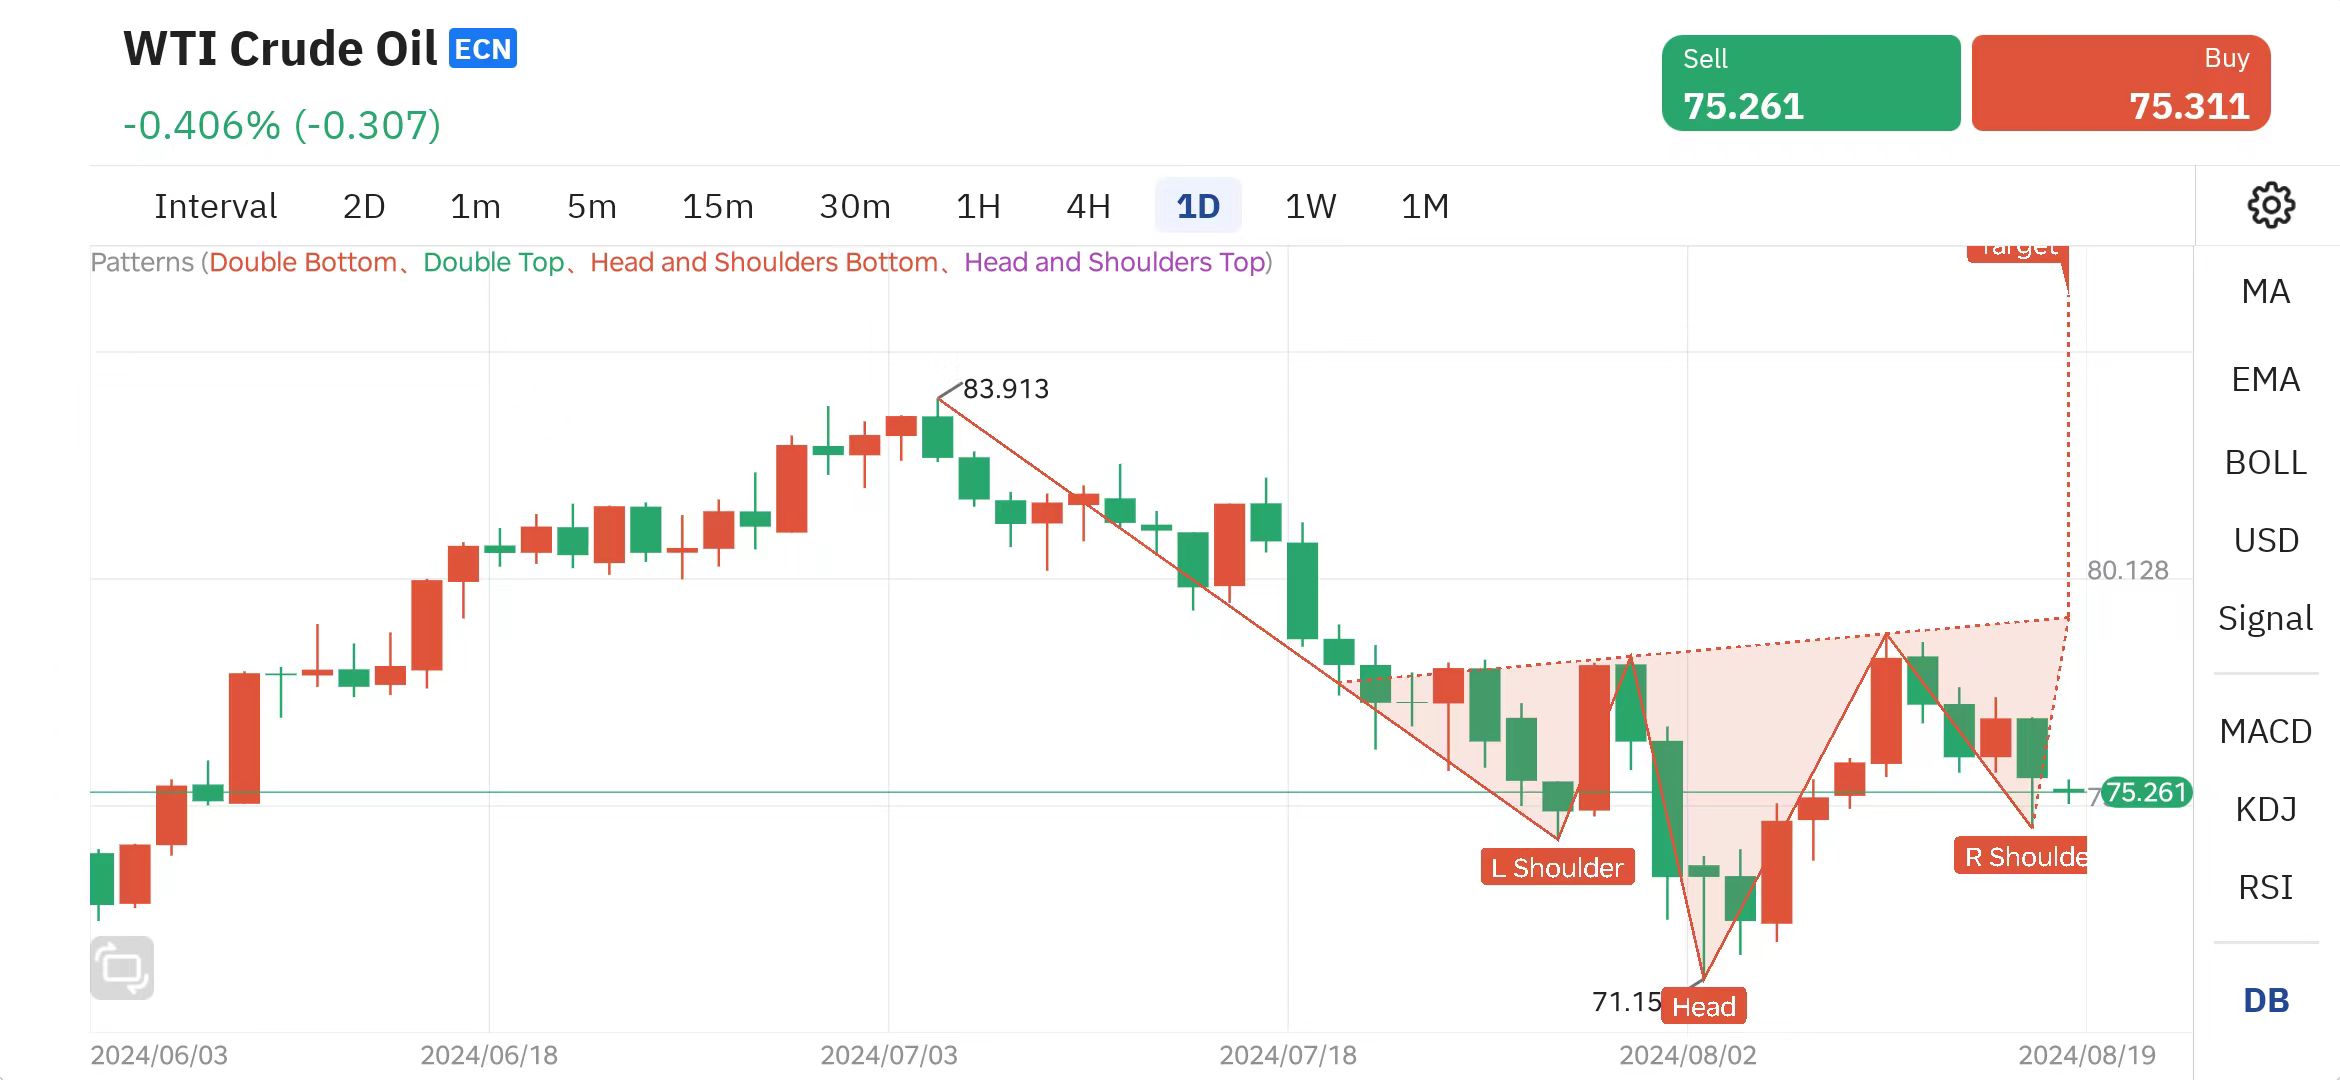
WTI Crude Oil (daily chart)
By carefully analyzing the current daily K-line chart of WTI crude oil, we can clearly observe that the market has presented a classic [Head and Shoulders Bottom Pattern]. According to historical experience, this pattern often indicates a potential upward trend. In the next few days, once the [Right Shoulder] pattern is established, we will have a valuable [Long] opportunity.
In order not to miss this opportunity, I suggest that investors should focus on WTI crude oil this week and use the signal tracking function of [Smart Assistant]. In this way, we can ensure that we receive the operation suggestions issued by the software at the critical moment, so as to accurately grasp the long opportunity brought by this [Head and Shoulders Bottom] pattern.
Specifically, investors need to pay close attention to the formation of the right shoulder and take buying actions in time after it is formed. In addition, the timing of closing the position after buying is also crucial, which will directly affect the maximization of investment returns. With the assistance of [Smart Assistant], we can deal with every fluctuation in the market more calmly and ensure that we make wise decisions in a complex trading environment.
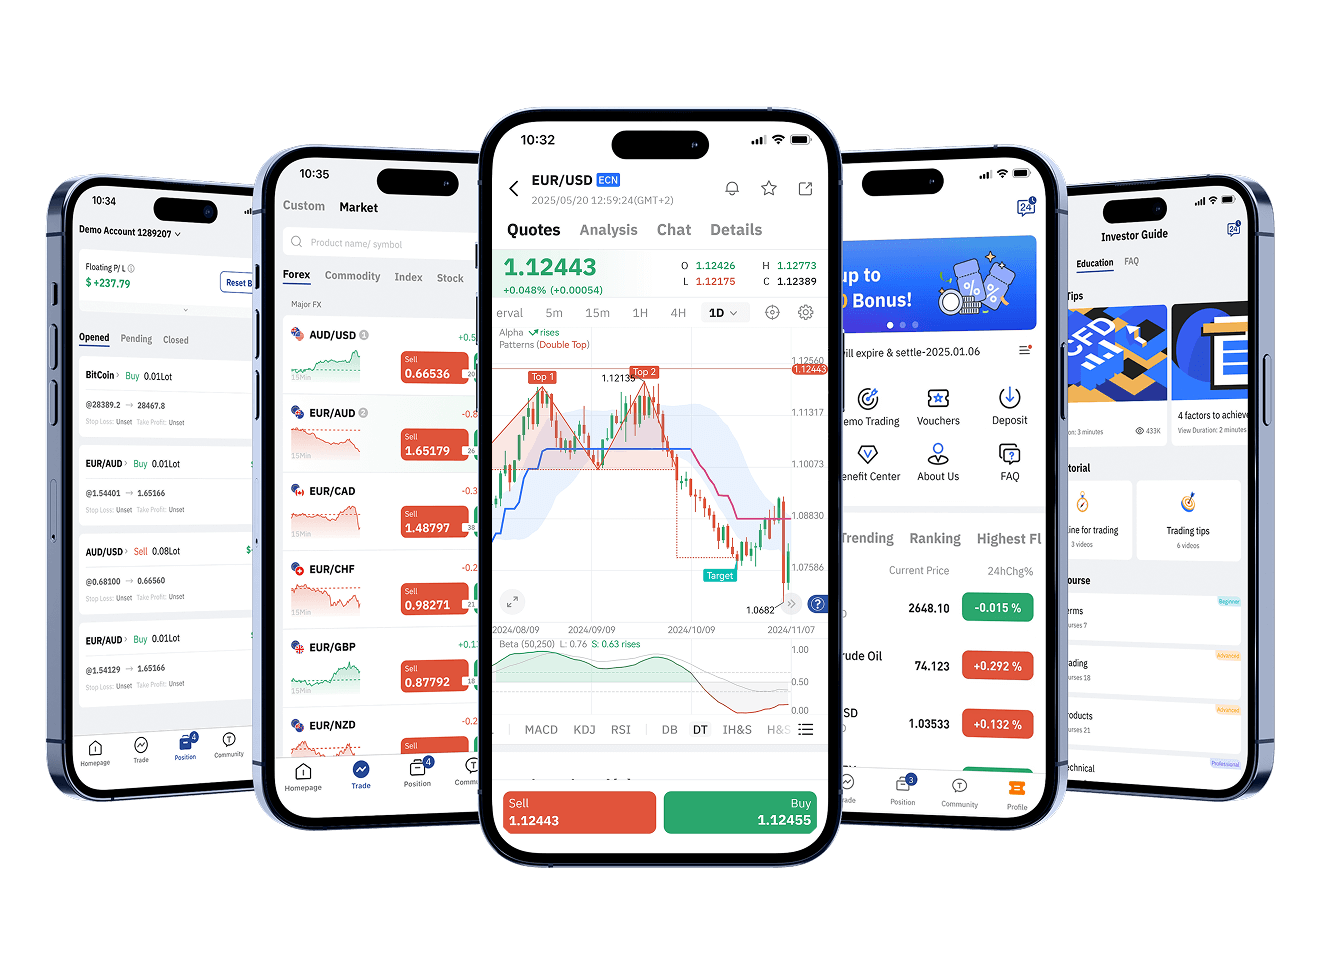
Download TOPONE Markets
Download TOPONE Markets
Get the most profitable trading signals first, 1 million traders have downloaded it, and the average daily profit opportunities exceed 200!