English


Last Week's Performance Analysis
- The Japanese Yen Explosion: Double your earnings in 5 hours; 43% of the profits are waiting for you!
- Gold Investment Explodes: Earn 54.45% in 6 hours. Come and join now!
- Nasdaq Plummeted: 3.3 times profit in 12 hours!
 Quantitative Indicator - USD (Super Trend)
· Nasdaq 100
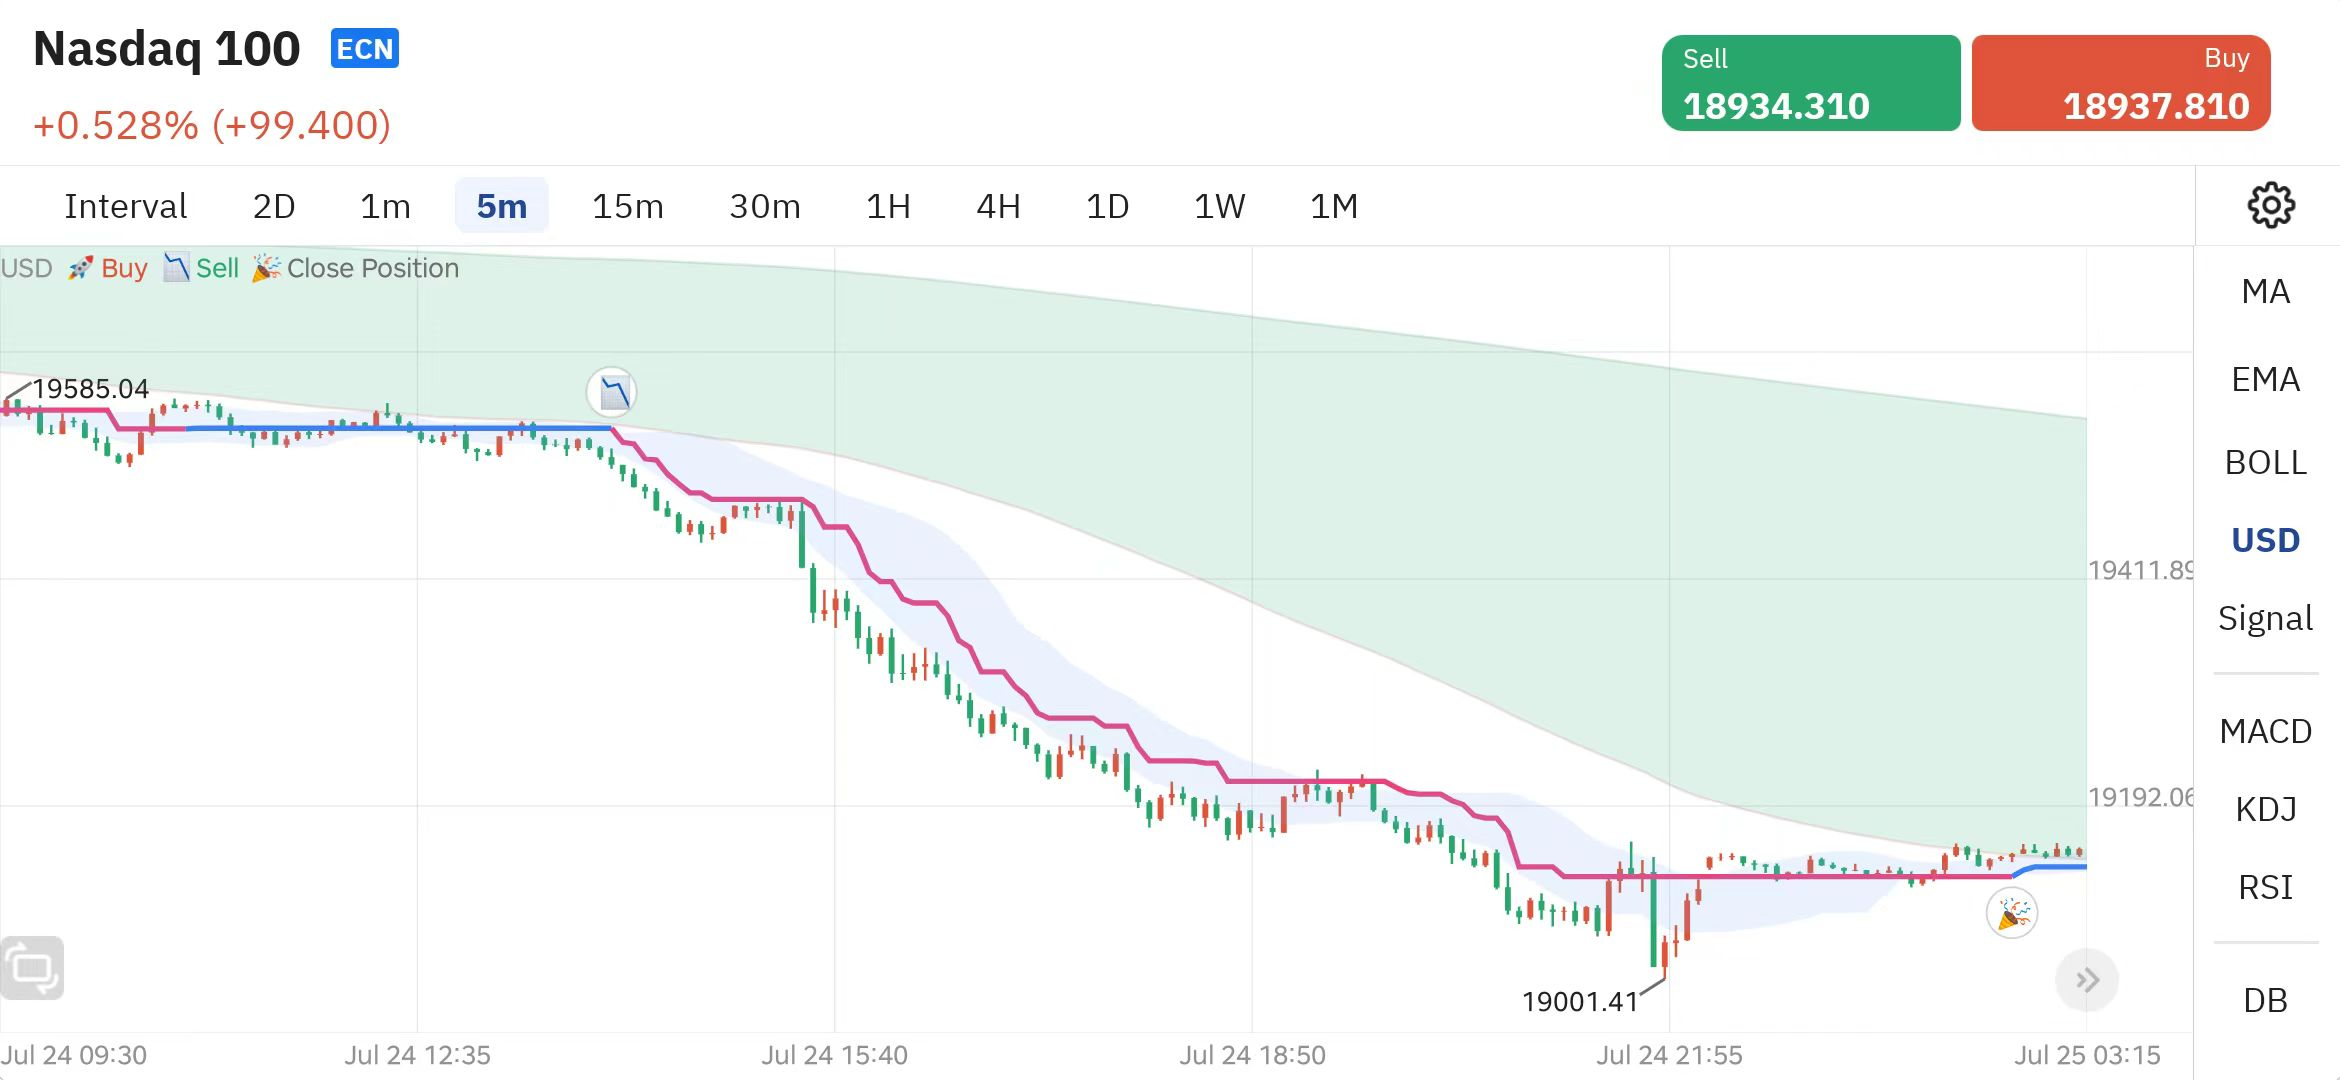
Nasdaq 100 (5-minute chart)
From 14:05 pm on July 24, 2024, the software issued a 📉 signal, which marked the beginning of a strong [bear market]. This trend continues until the 🎉 signal appears at 2:45 pm on July 25, 2024, which means the end of the [bear market].
During this time period, the operating range is 415.75 points. The main trend strategy during this period is [short selling].
Intelligent pattern recognition· USD/JPY
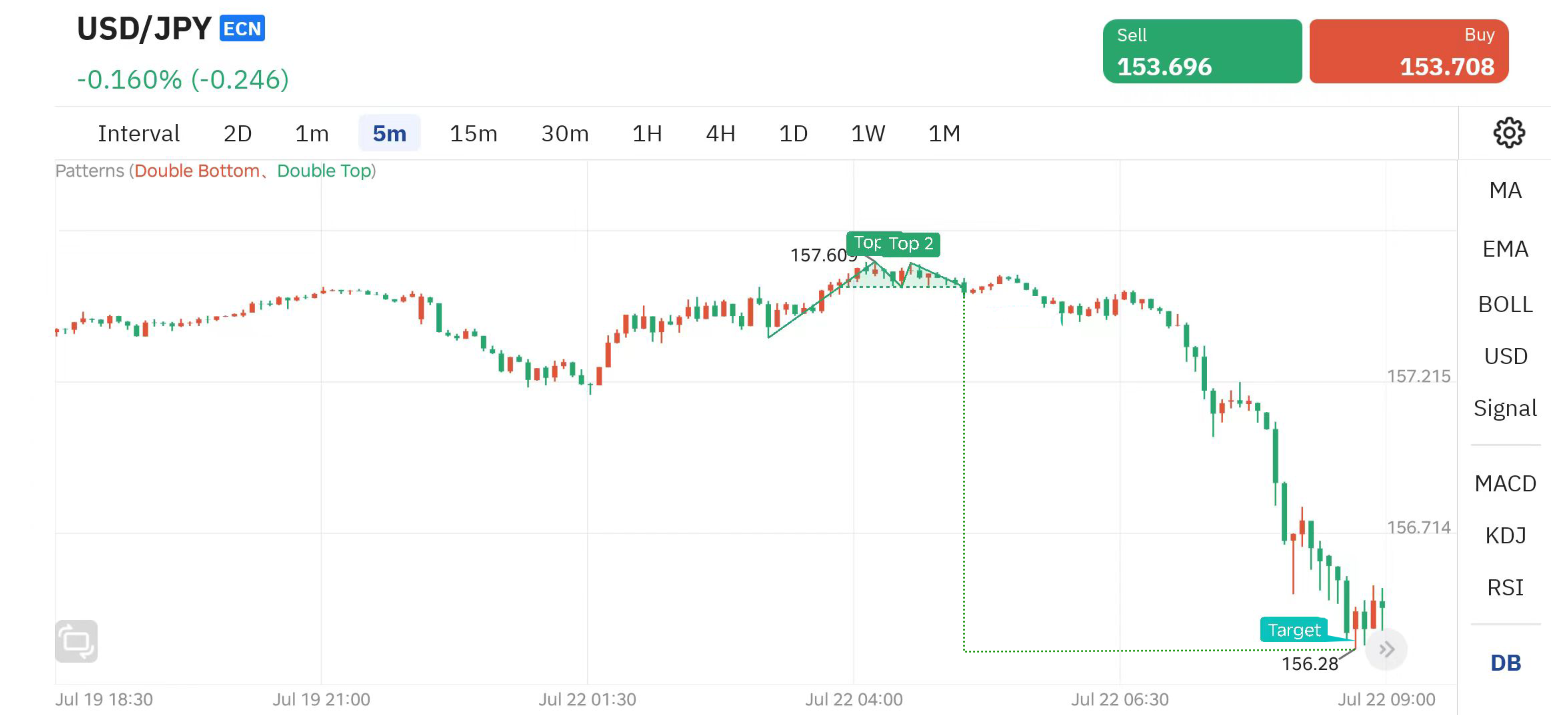
USD/JPY (5-minute chart)
At 3:45 a.m. on July 22, the system sent out a signal for the first time.
Thirty minutes later, at 4:15, we observed the [first top] forming. Then 20 minutes later, at 4:35, [the second top] was formed, marking the establishment of the [double top pattern]. Immediately, we decisively [went short] at the price of 157.605.
At 8:45, the system prompts that the [target] has been reached, and we [close the position] at the price of 156.28.
· Gold
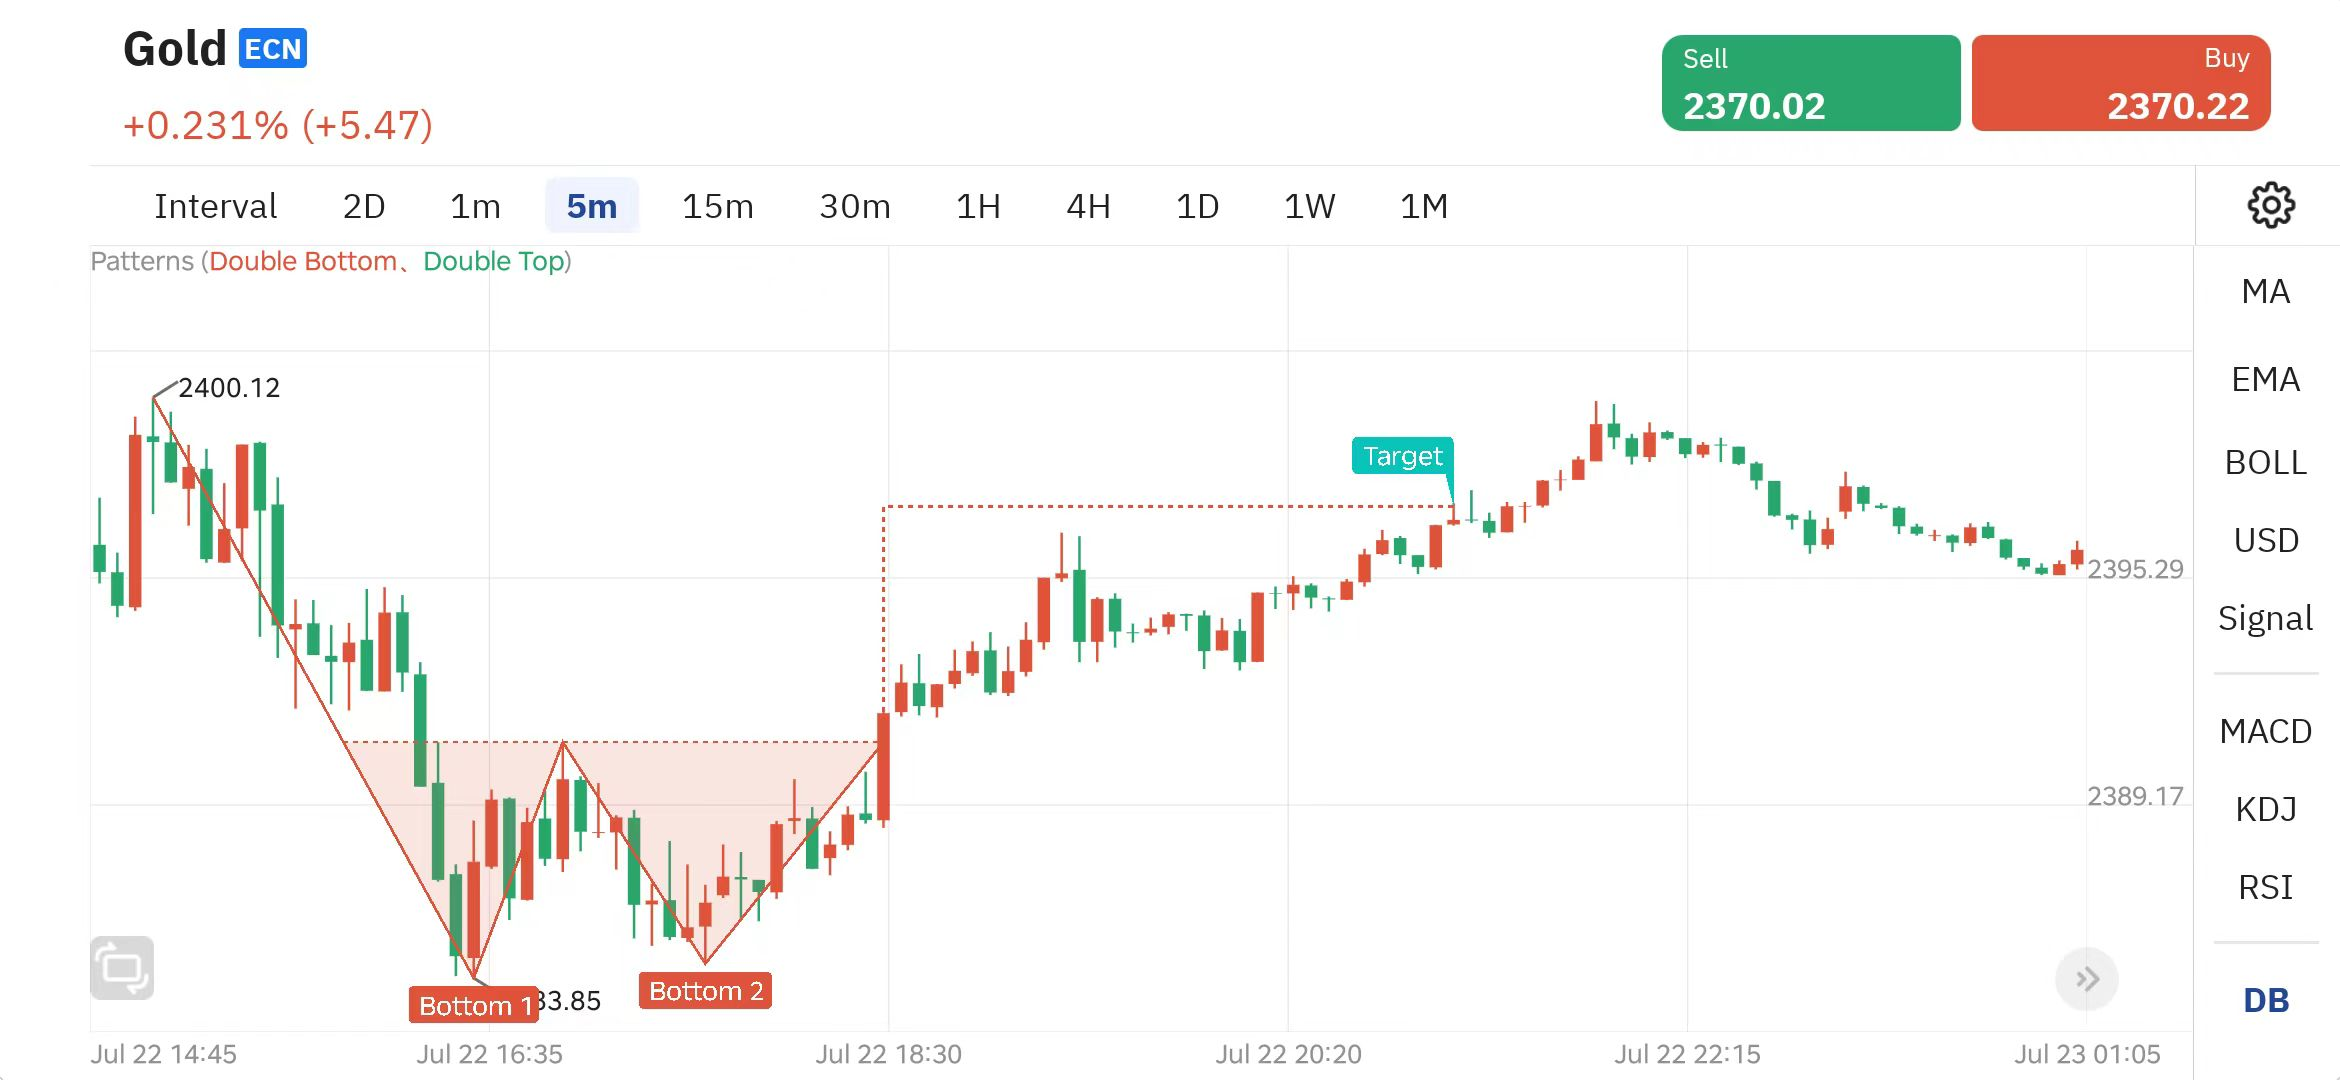
Spot Gold (5-minute chart)
At 15:05 pm on July 22, the system sent a signal for the first time.
90 minutes later, at 16:35, we observed the formation of [the first bottom]. Then 65 minutes later, at 17:40, [the second bottom] was formed, marking the establishment of the [double bottom pattern]. Immediately, we decisively [went long] at the price of 2384.25.
At 21:10, the system prompts that the [target] has been reached, and we [close the position] at the price of 2397.15.
Weekly Trending Product Analysis
WTI Crude Oil
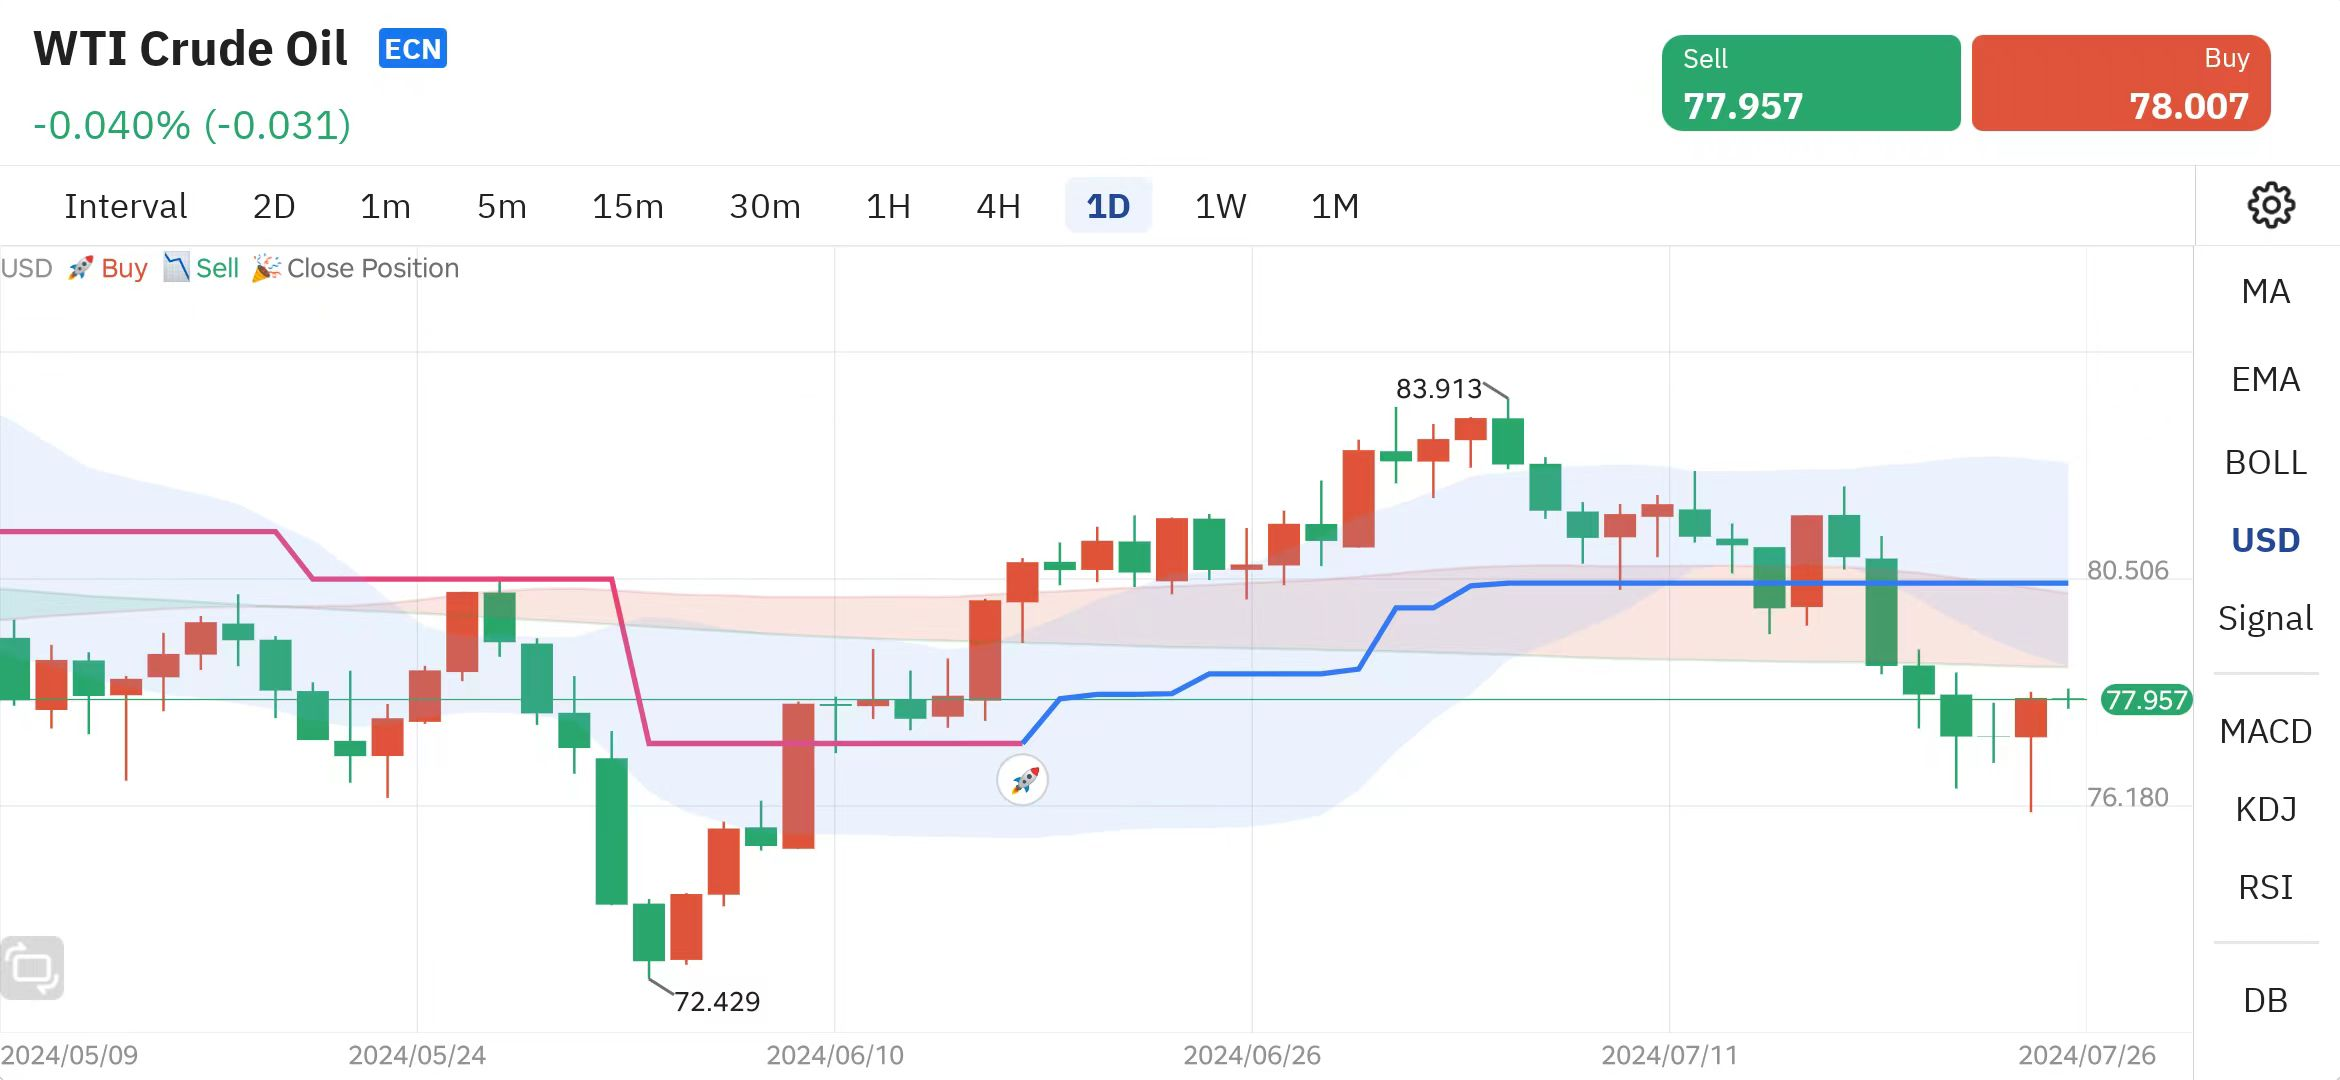
WTI Crude Oil (daily chart)
Starting from June 18, 2024, the software sent out the 🚀 signal, indicating the beginning of the [bull trend].
This trend has not yet shown a 🎉 signal, which means that the [bull trend] will continue. At present, the short-term maximum interest rate spread range has reached 4834 points, and there is still nearly 3000-4000 points in the future. The symbol 🎉 will be issued at any time this week, so investors who are locked into the trend should be prepared for operations.
Weekly Trending Product Analysis
BTC
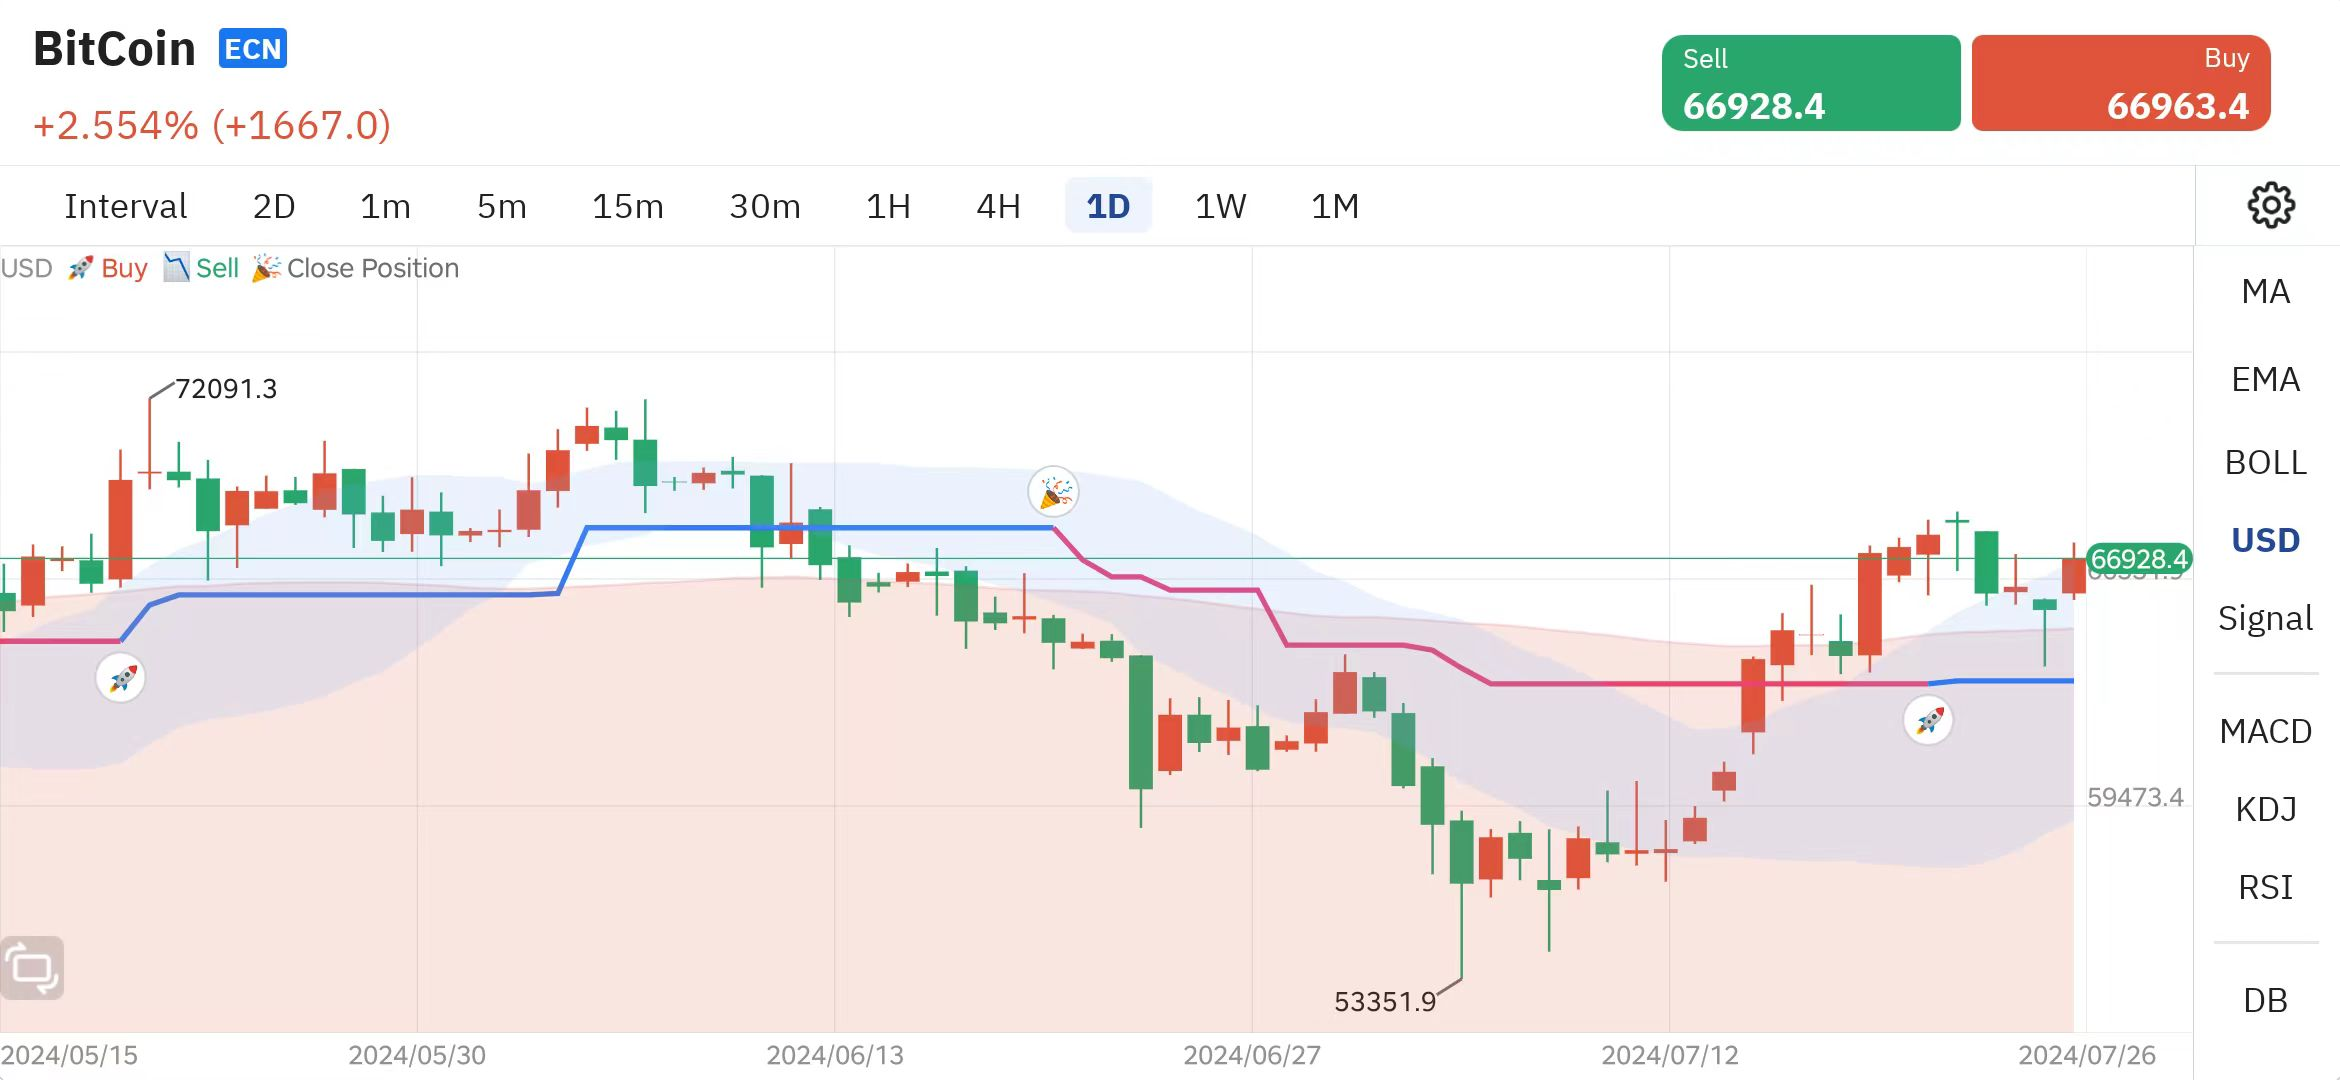
BTC (daily chart)
The short 📉 signal that we were waiting for last week has not yet appeared. Instead, a 🚀 long signal has appeared this week, indicating that the future trend will be dominated by [bullish trend].
Judging from the entry position given by the current information, the price will also face two to three resistance levels. Therefore, investors who have locked Bitcoin as their preferred investment target should set up signal tracking to facilitate receiving operating instructions from the software.
Download TOPONE Markets
Download TOPONE Markets
Get the most profitable trading signals first, 1 million traders have downloaded it, and the average daily profit opportunities exceed 200!