English


 Performance Overview
 Double top remains strong, gold welcomes 223.23% profit space!
- Bottom Double Bottom Opportunity, WTI Crude Oil Soars 111.22% in 5 Hours!
Best Performance of Last Week
AI backtracks classic patterns to analyze high-value signal features.
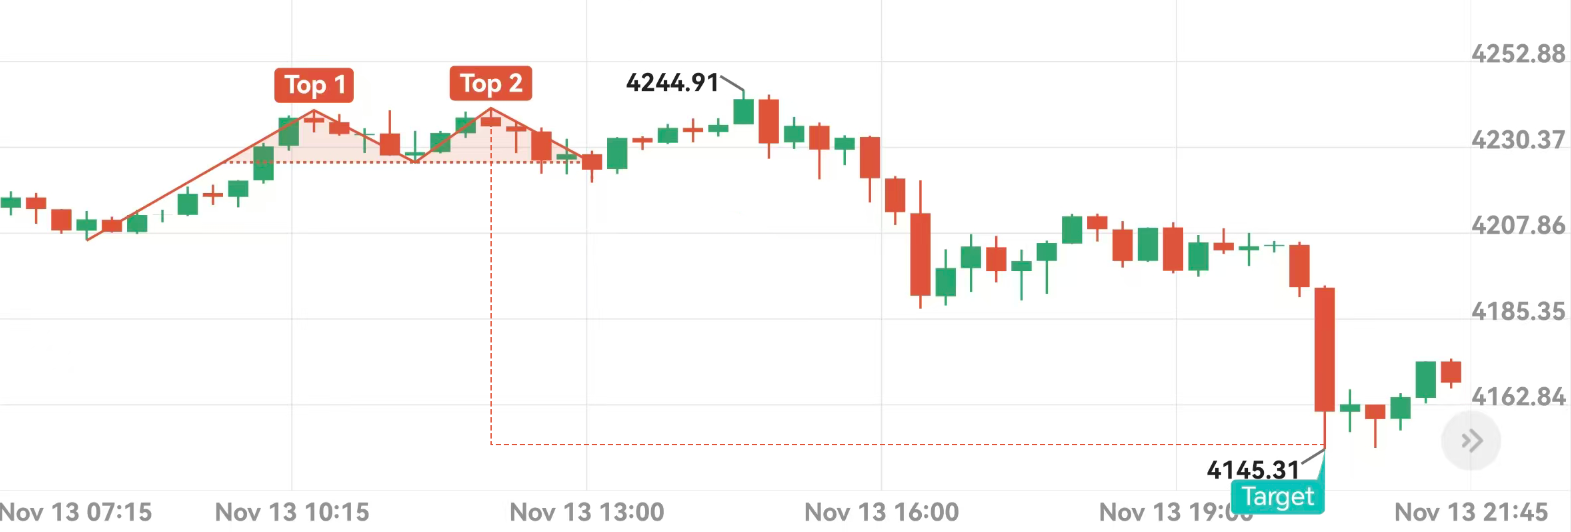
Signal Entry
@4239.96Take Profit
4145.31Profitability 
+223.23%Signal Commentary
At 12:00 on November 25, 2013, the spot gold closing price formed a double top, indicating a second peak. The confirmation of the double top signaled the arrival of a downtrend. 8.5 hours later, the double top target was reached, with a profit target of 4145.31. This round of trading recorded a profit of +223.23%, making it one of the best-performing signals of the week.
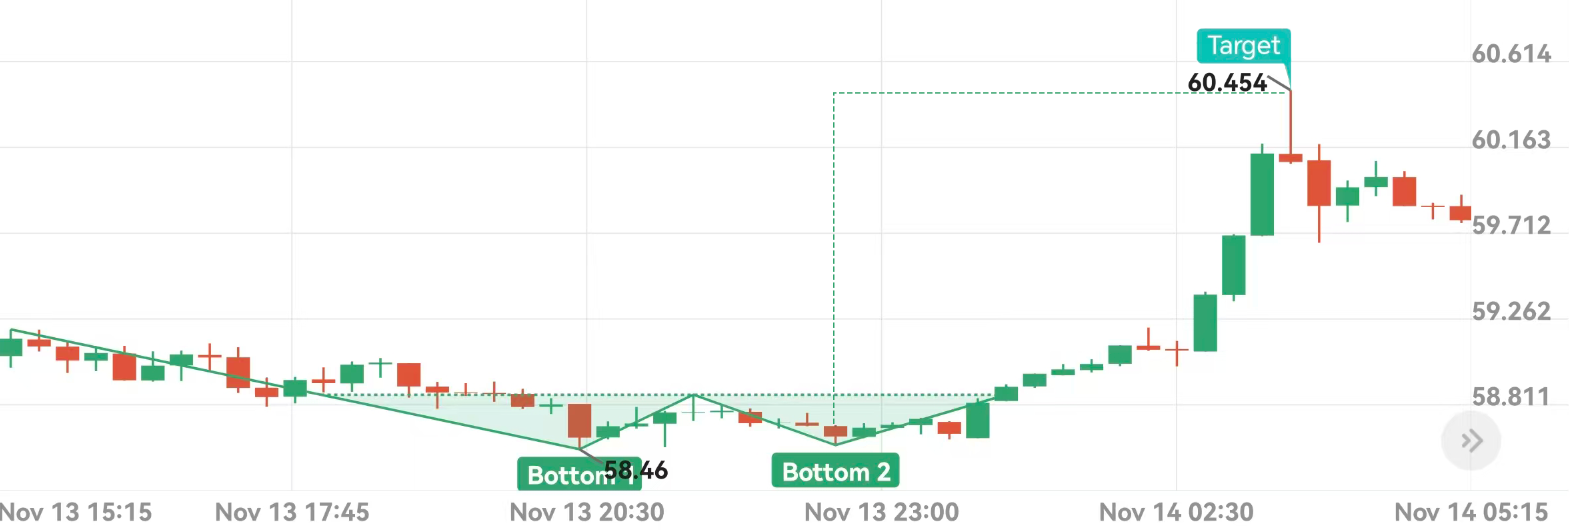
Signal Entry
@58.483Take Profit
60.454Profitability
+111.22%Signal Commentary
On November 25, 2013 at 22:30, WTI crude oil closed with a double bottom pattern, indicating a potential upward trend. Five hours later, the double bottom target was reached, with a profit target of 60.454. This round of trading yielded a return of +111.22%, making it one of the best-performing signals of the week.
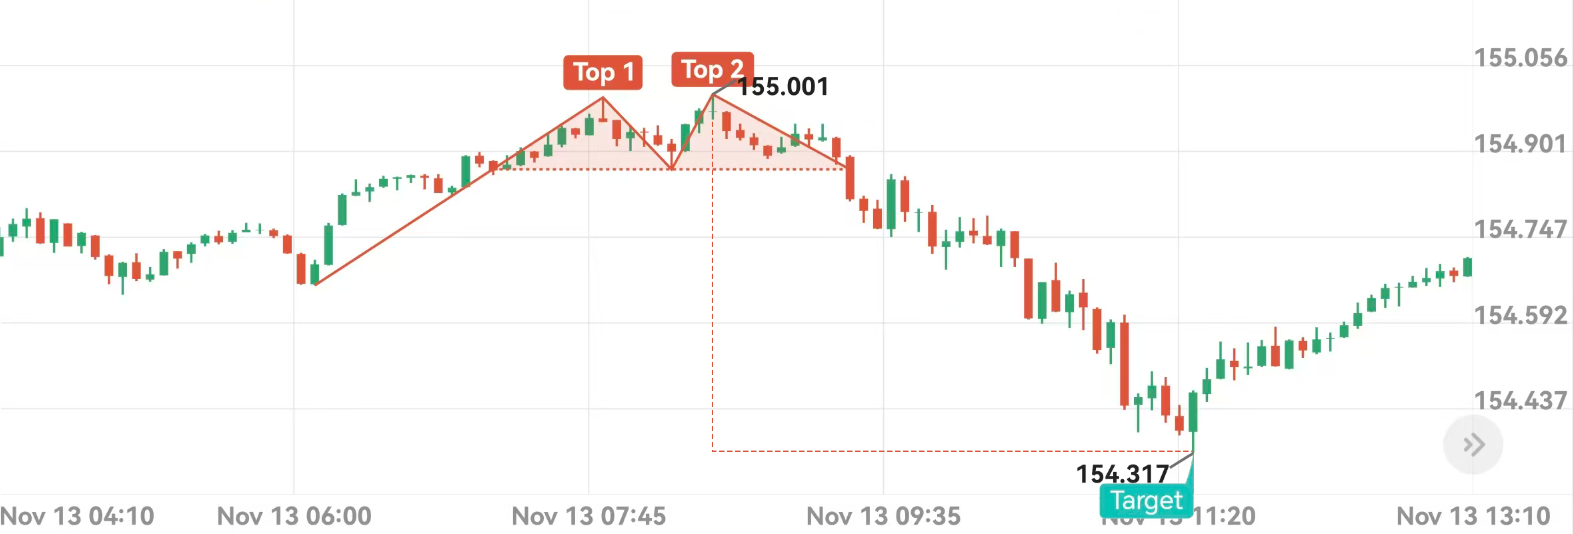
Signal Entry
@155.001Take Profit
154.317Profitability
+23.12%Signal Commentary
At 8:30 on November 25, 2013, the USD/JPY closing price formed a double top, indicating a second top. The confirmation of the double top signaled the arrival of a downtrend. Three hours later, the double top target was reached, with a profit target of 154.317. This round of trading recorded a profit of +23.12%, making it one of the best-performing signals of the week.
Hot Opportunities This Week
Track the evolution of classic patterns in real time and identify potential trading opportunities.
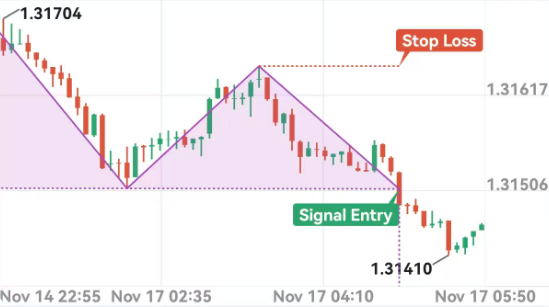
Signal Entry
@1.31514Take Profit
1.31280Stop Loss
1.31645Opportunity Analysis
At 5:00 AM on November 25, 2017, the GBP/USD pair confirmed a head and shoulders pattern on the 5-minute chart. The closing price broke below the neckline, confirming the head and shoulders pattern and indicating an impending shift from an uptrend to a downtrend. Bearish outlook; take profit at 1.31280, stop loss at 1.31645.
Review Past Analyses
*Disclaimer
TOPONE Markets' AI pattern recognition provides only pattern-based analysis and does not constitute investment advice or a guarantee of returns. It is recommended to unlock premium access to view the latest pattern signals, respond to market changes, and manage risk appropriately.
Download TOPONE Markets
Download TOPONE Markets
Get the most profitable trading signals first, 1 million traders have downloaded it, and the average daily profit opportunities exceed 200!