English


 Performance Overview
 Golden Double Top Welcomes Plunge, Netting 252.69% in 24 Hours!
- After 6.5 hours of intense trading, the WTI crude oil bearish triangle strategy achieved a modest profit of 52.86%!
Best Performance of Last Week
AI backtracks classic patterns to analyze high-value signal features.
Signal Entry
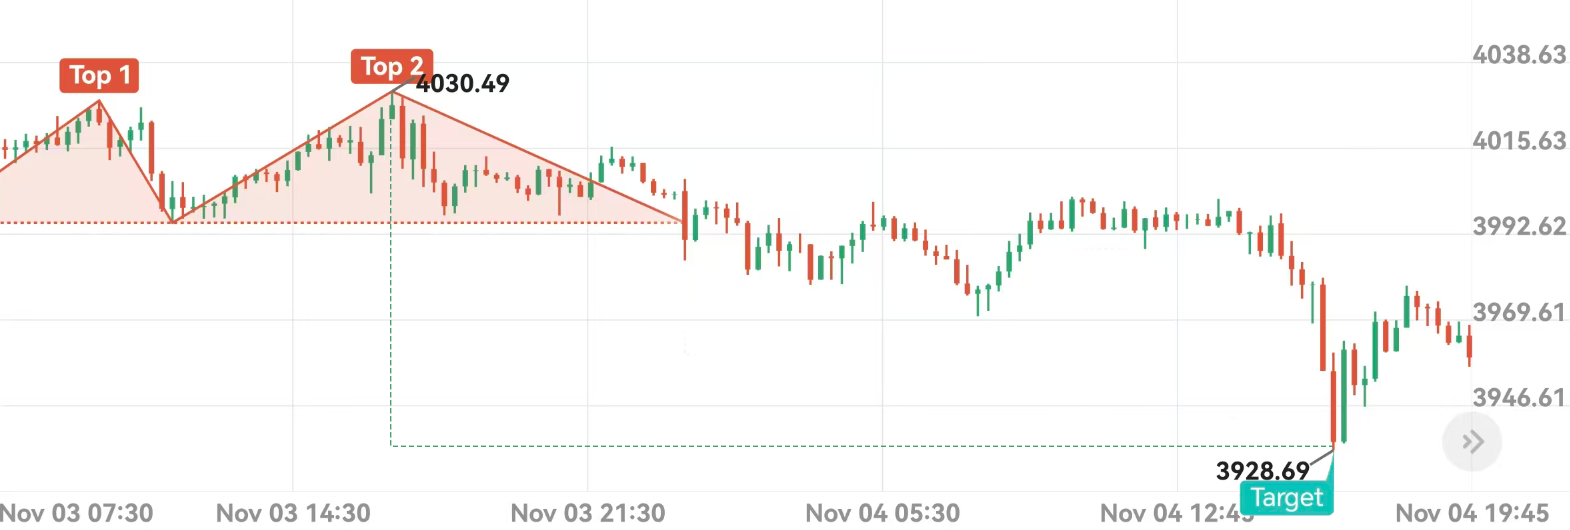
@4030.49Take Profit
3928.69Profitability 
+252.57%Signal Commentary
At 17:00 on November 25th, the spot gold closing price formed a double top, indicating a second peak. The confirmation of the double top signaled the arrival of a downtrend. 23.5 hours later, the double top target was reached, with a profit target of 3928.69. This round of trading recorded a profit of +252.69%, making it one of the best-performing signals of the week.
 Bearish Pennant
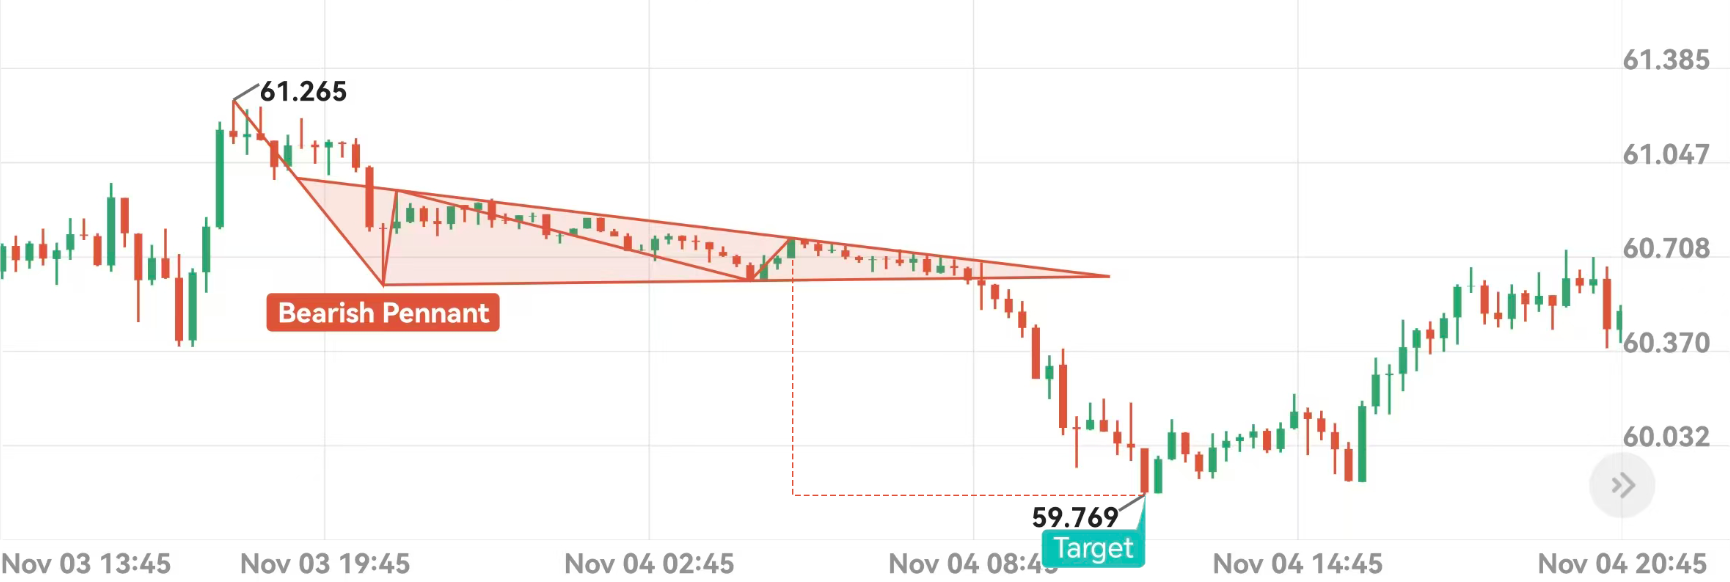
Signal Entry
@60.742Take Profit
59.769Profitability
+52.86%Signal Commentary
At 5:30 AM on November 25th, WTI crude oil closed with a double top forming a bearish triangle pattern. The confirmation of the bearish triangle pattern indicates the arrival of a downtrend. 6.5 hours later, the target of the bearish triangle pattern was reached, with a profit target of 59.769. This round of trading recorded a profit of +52.86%, making it one of the best-performing signals of the week.
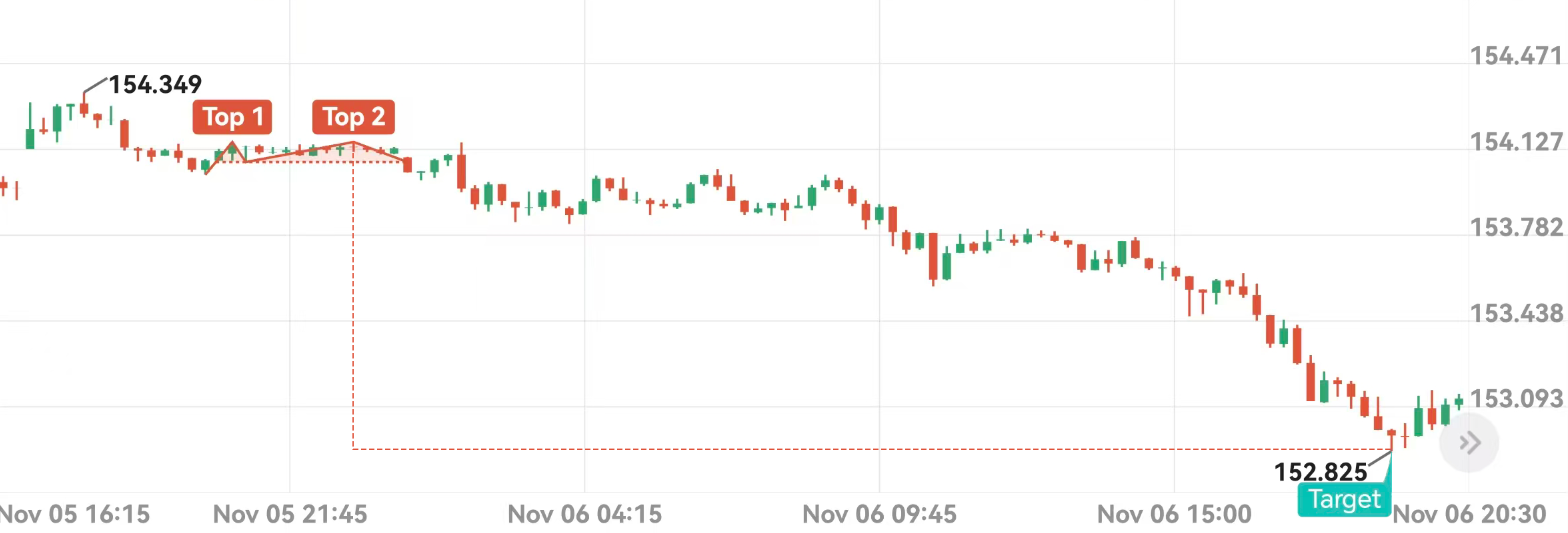
Signal Entry
@154.138Take Profit
152.825Profitability
+44.38%Signal Commentary
At 23:00 on November 25th, the USD/JPY closing price formed a double top, indicating a second top. The confirmation of the double top signaled the arrival of a downtrend. Twenty hours later, the double top target was reached, with a profit target of 152.825. This round of trading yielded a profit of +44.38%, making it one of the best-performing signals of the week.
Hot Opportunities This Week
Track the evolution of classic patterns in real time and identify potential trading opportunities.
 Bullish Flag
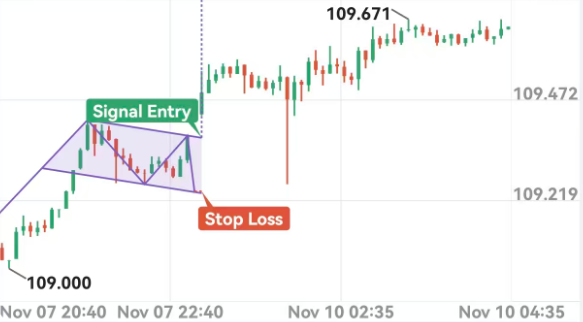
Signal Entry
@109.356Take Profit
109.893Stop Loss
109.208Opportunity Analysis
At 1:00 AM on November 25, 2010, the closing price broke through the upper trendline of the bullish flag pattern, confirming the bullish flag pattern and indicating that the market correction has ended and will continue to rise. Bullish, with a take-profit price of 109.893 and a stop-loss price of 109.208.
Review Past Analyses
*Disclaimer
TOPONE Markets' AI pattern recognition provides only pattern-based analysis and does not constitute investment advice or a guarantee of returns. It is recommended to unlock premium access to view the latest pattern signals, respond to market changes, and manage risk appropriately.
Download TOPONE Markets
Download TOPONE Markets
Get the most profitable trading signals first, 1 million traders have downloaded it, and the average daily profit opportunities exceed 200!