English


 Performance Overview
 Spot gold battles for 9 hours, achieving a hefty profit of 81.5%!
- Bearish triangle for crude oil, 51% profit in 3 hours!
Best Performance of Last Week
AI backtracks classic patterns to analyze high-value signal features.
 Bullish Pennant
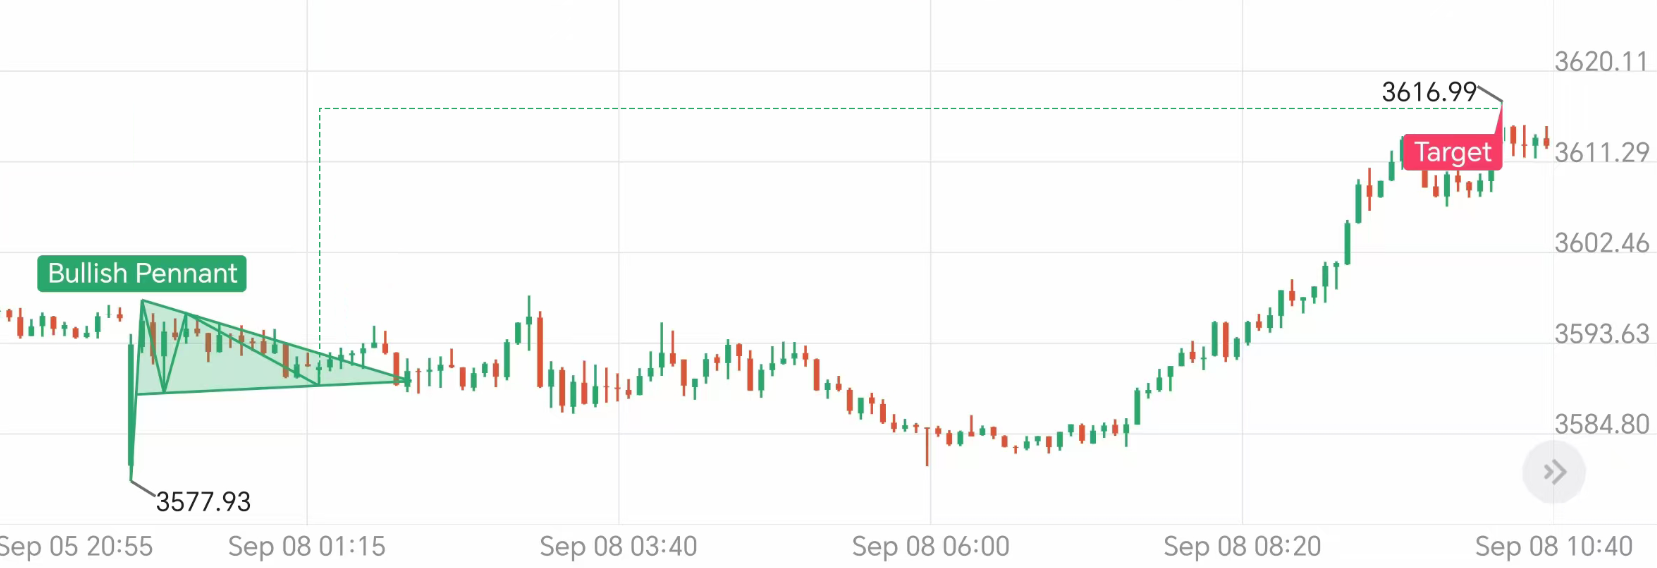
Signal Entry
@3587.75Take Profit
3616.99Profitability 
+81.5%Signal Commentary
At 1:30 on September 8, 25, the closing price of spot gold formed a [bullish pennant] and touched the bottom for the second time. The [bullish pennant] confirmed the arrival of an upward trend. Nine hours later, the [bullish pennant] target was achieved, and the take-profit was 3616.99. This round of operations recorded a profit of +81.5%, which can be regarded as one of the best performing signals last week.
 Bearish Pennant
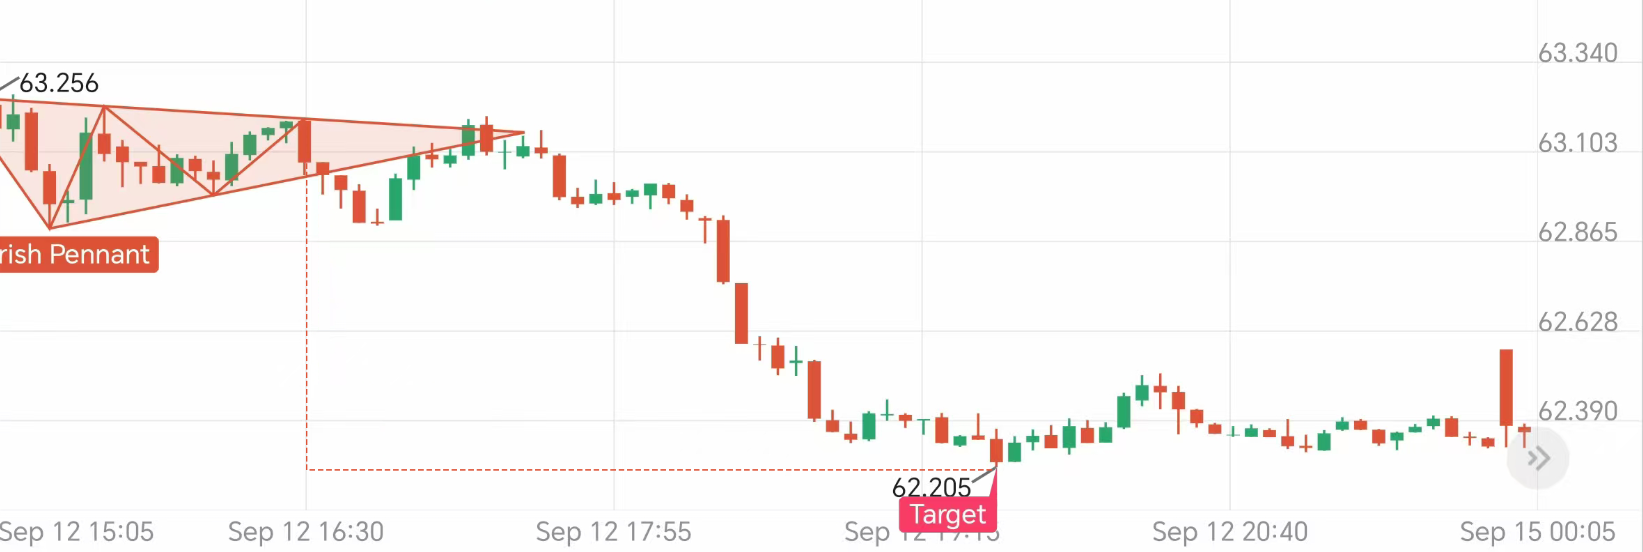
Signal Entry
@63.182Take Profit
62.205Profitability
+51.03%Signal Commentary
At 16:30 on 25/9/12, the closing price of WTI crude oil formed a [bearish pennant] and touched the top for the second time. The [bearish pennant] confirmed the arrival of a downward trend. Three hours later, the [bearish pennant] target was achieved, and the take-profit was 62.205. This round of operation recorded a +51.03% profit, which can be regarded as one of the best performing signals last week.
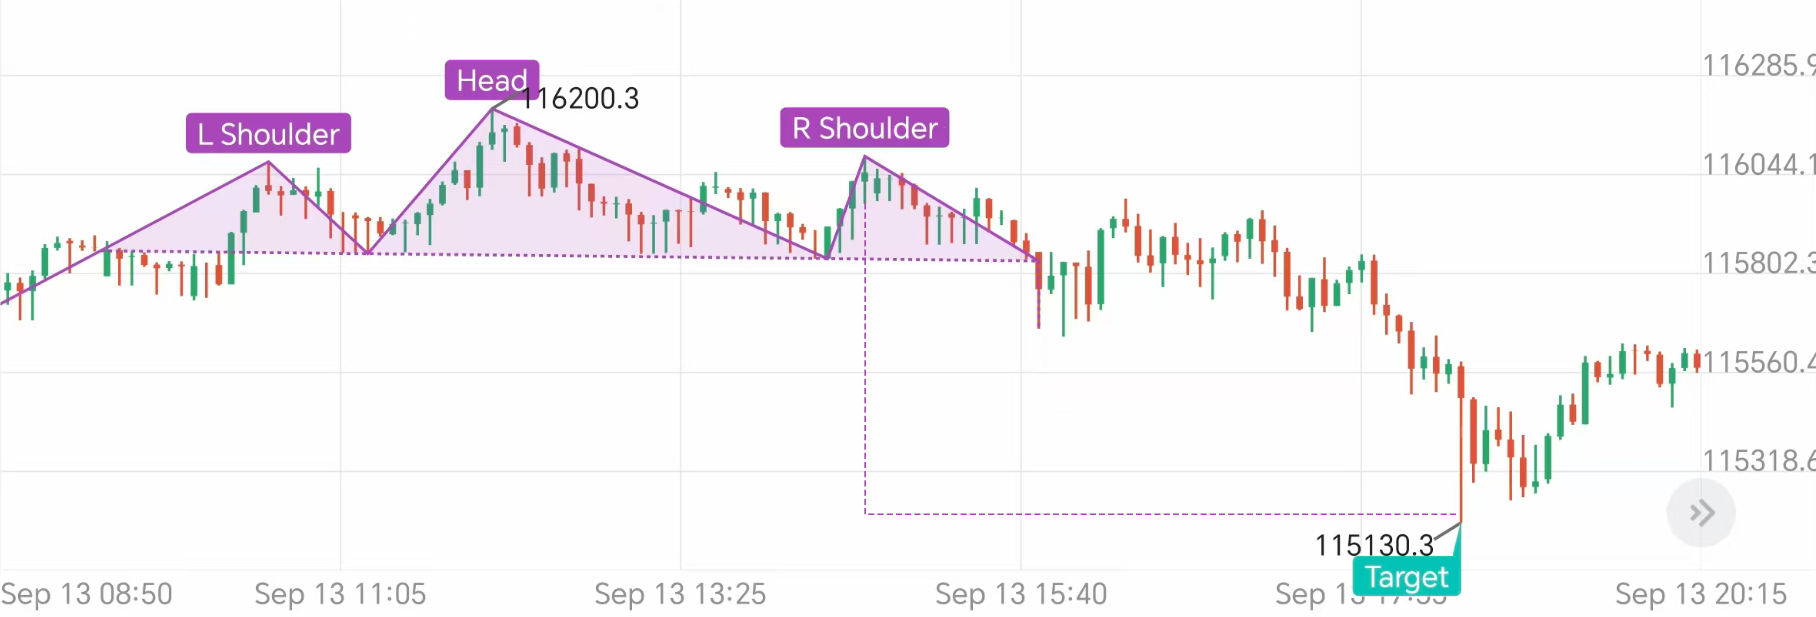
Signal Entry
@116077.5Take Profit
115130.3Profitability
+8.16%Signal Commentary
At 14:30 on 25/9/13, the closing price of Bitcoin formed a [Head and Shoulders Top] and touched the top three times. The confirmation of the [Head and Shoulders Top] indicated the arrival of a downward trend. Four hours later, the [Head and Shoulders Top] target was achieved, and the stop profit was 115130.3. This round of operation recorded a profit of +8.16%, which can be regarded as one of the best performing signals last week.
Hot Opportunities This Week
Track the evolution of classic patterns in real time and identify potential trading opportunities.
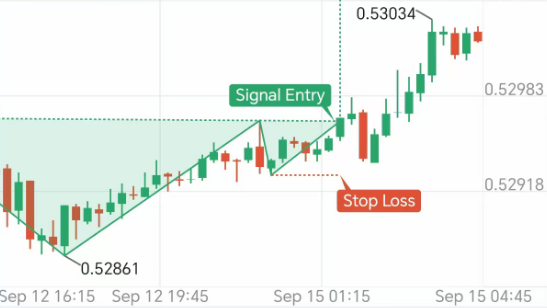
Signal Entry
@0.52945Take Profit
053059Stop Loss
0.52920Opportunity Analysis
At 1:45 AM on September 15, 25, the closing price broke through the neckline, confirming the head and shoulders bottom pattern, indicating that the market is about to turn from a downtrend to an uptrend. For a bullish trend, the take-profit level is 053059 and the stop-loss level is 0.52920.
Review Past Analyses
*Disclaimer
TOPONE Markets' AI pattern recognition provides only pattern-based analysis and does not constitute investment advice or a guarantee of returns. It is recommended to unlock premium access to view the latest pattern signals, respond to market changes, and manage risk appropriately.
Download TOPONE Markets
Download TOPONE Markets
Get the most profitable trading signals first, 1 million traders have downloaded it, and the average daily profit opportunities exceed 200!