English


 Performance Overview
 Spot Gold Giant Triangle, 169% Profit in 18 Hours!!!
- Crude oil double top flattened and plummeted, raking in 114% profit!
Best Performance of Last Week
AI backtracks classic patterns to analyze high-value signal features.
 Bullish Pennant
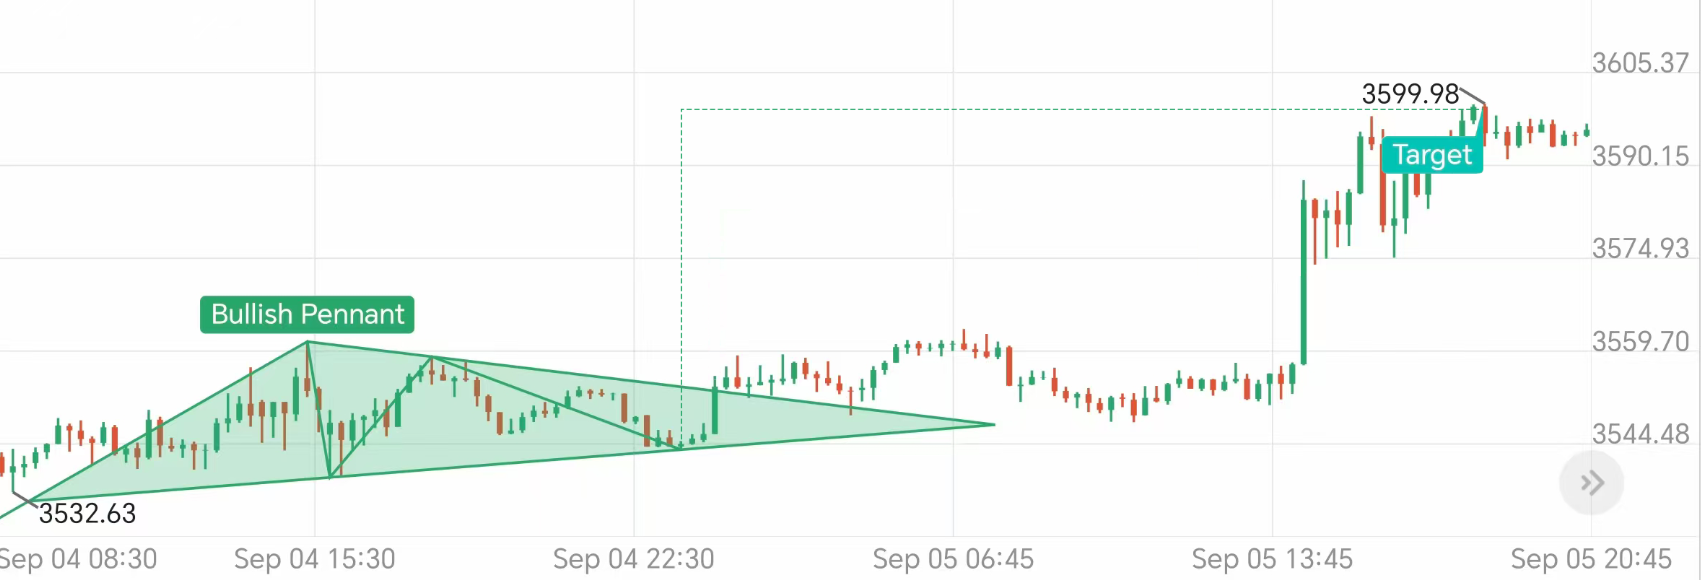
Signal Entry
@3539.99Take Profit
3599.98Profitability 
+169.46%Signal Commentary
On 25/9/5 00:30, the closing price formed a [Bullish Pennant] and touched the bottom for the second time. The [Bullish Pennant] confirmed the arrival of an upward trend. 18 hours later, the [Bullish Pennant] target was achieved, and the take-profit was 3599.98. This round of operations recorded a profit of +169.46%, which can be regarded as one of the best performing signals last week.
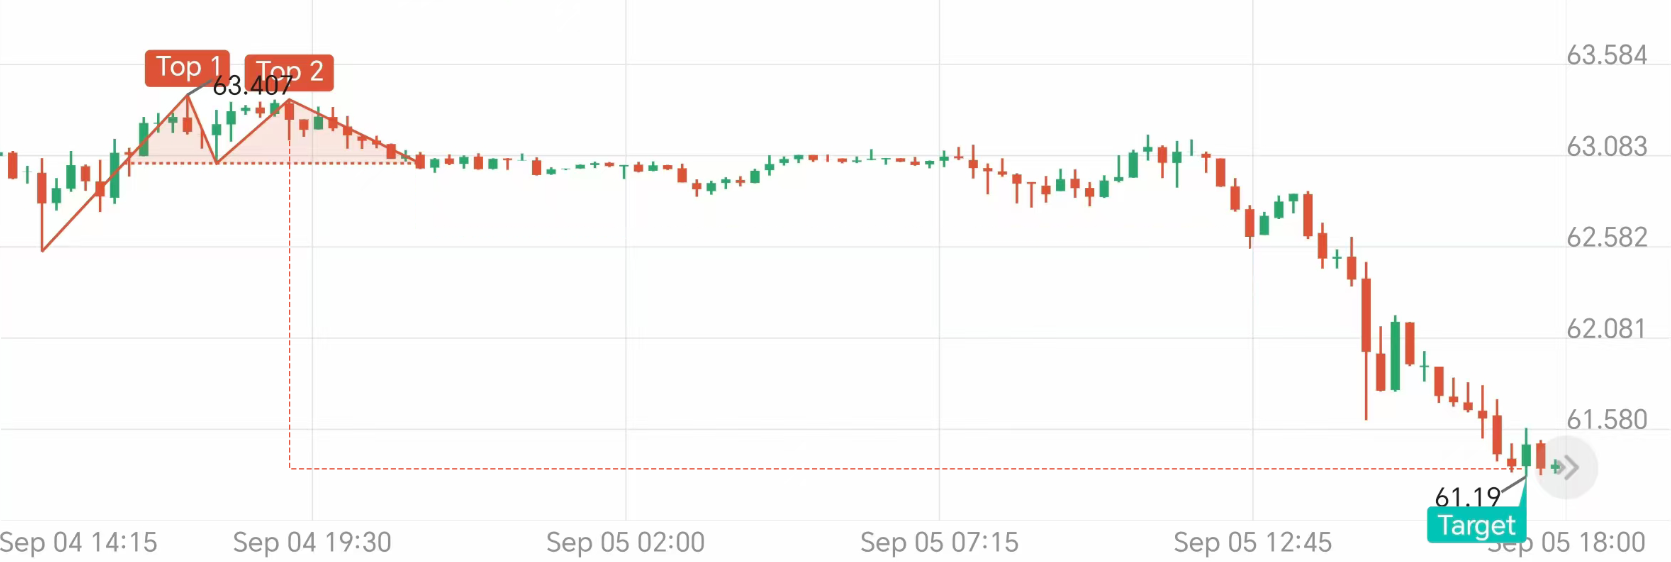
Signal Entry
@63.381Take Profit
61.19Profitability
+114.08%Signal Commentary
At 19:00 on 25/9/4, the closing price formed a [double top] and touched the top for the second time. The confirmation of the [double top] indicated the arrival of a downward trend. 22.5 hours later, the [double top] target was achieved, and the take-profit was 61.19. This round of operations recorded a profit of +114.08%, which can be regarded as one of the best performing signals last week.
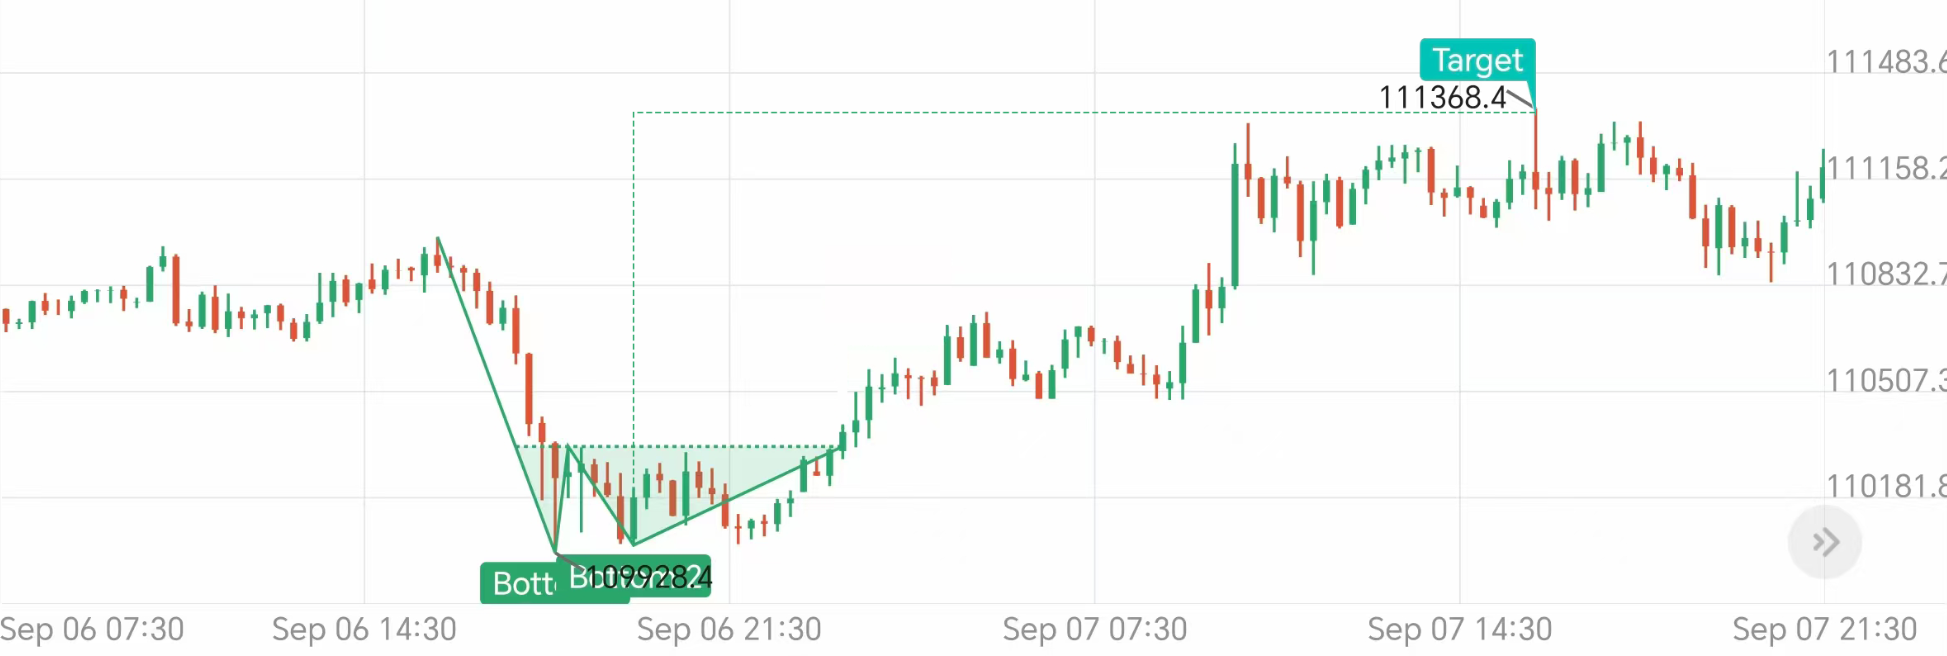
Signal Entry
@109953.4Take Profit
111321.1Profitability
+12.44%Signal Commentary
At 19:30 on 25/9/6, the closing price formed a [double bottom] and touched the bottom for the second time. The confirmation of the [double bottom] indicated the arrival of an upward trend. 15 hours later, the [double bottom] target was achieved, and the stop profit was 111321.1. This round of operation recorded a +12.44% return, which can be regarded as one of the best performing signals last week.
Hot Opportunities This Week
Track the evolution of classic patterns in real time and identify potential trading opportunities.
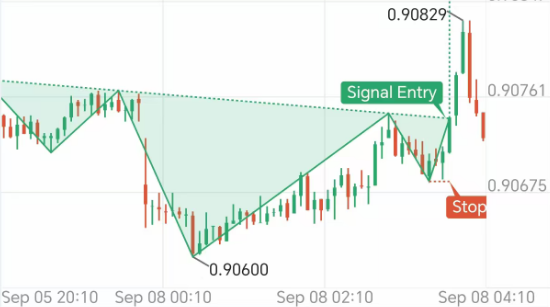
Signal Entry
@0.90733Take Profit
0.90873Stop Loss
0.90673Opportunity Analysis
At 3:45 AM on September 8, 25th, the closing price broke through the neckline, confirming the head and shoulders bottom pattern, indicating that the market is about to turn from a downtrend to an uptrend. For a bullish trend, the take profit level is 0.90873 and the stop loss level is 0.90673.
Review Past Analyses
*Disclaimer
TOPONE Markets' AI pattern recognition provides only pattern-based analysis and does not constitute investment advice or a guarantee of returns. It is recommended to unlock premium access to view the latest pattern signals, respond to market changes, and manage risk appropriately.
Download TOPONE Markets
Download TOPONE Markets
Get the most profitable trading signals first, 1 million traders have downloaded it, and the average daily profit opportunities exceed 200!