English


Last Week's Performance Analysis
- 【Bullish Triangle】, 34.98% net profit in 5 hours!
- WTI crude oil made a huge profit of 77.43% in 8.5 hours!
 AI form
· Spot gold
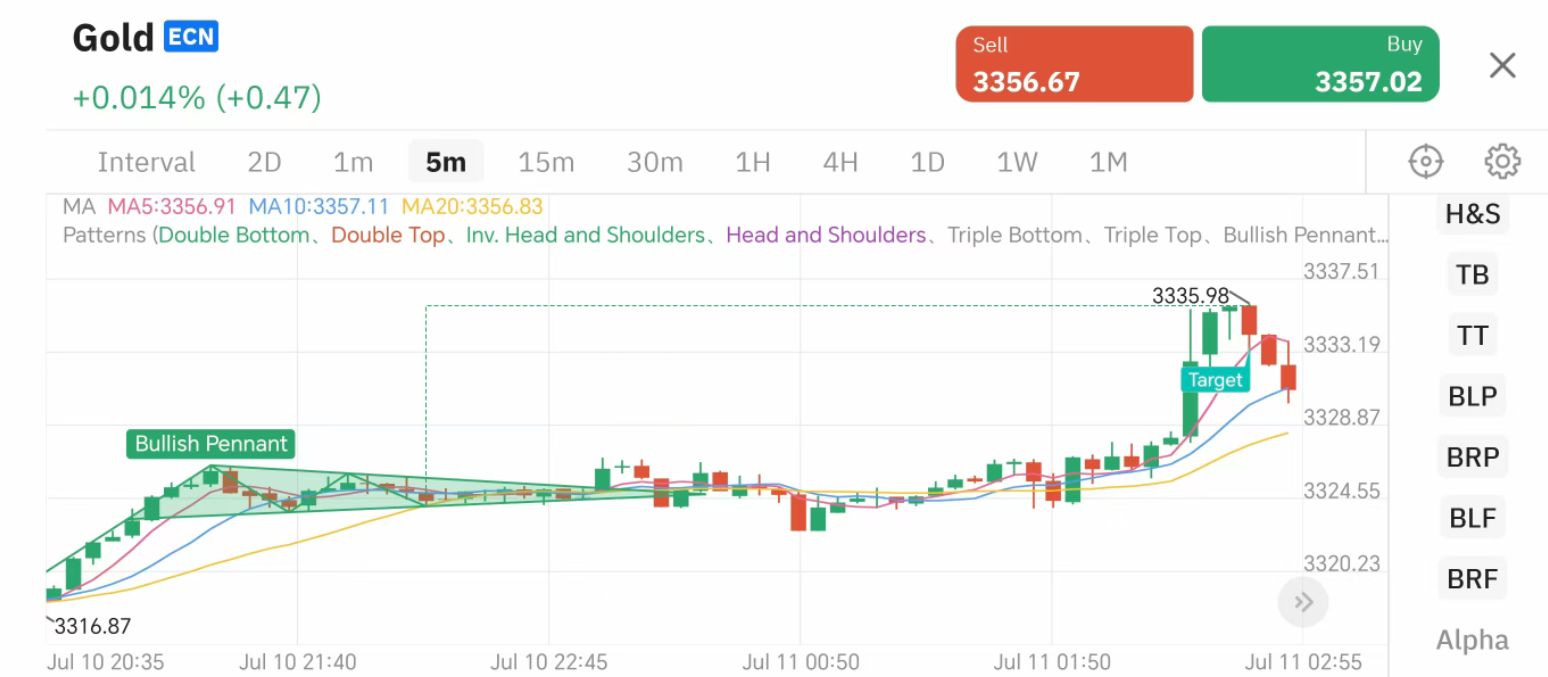
Spot Gold (5-minute Chart)
Date: 7/10
Time: 22:15
Pattern: Bullish Triangle
Take profit: 3335.98
Yield: 34.98%
Signal Comments:
At 22:15 on July 10, the closing price formed a [bullish triangle] and bottomed out for the second time. The confirmation of the [bullish triangle] pattern indicated the arrival of an upward trend. Five hours later, the [bullish triangle] pattern target was achieved, with a stop profit of 3335.98. This round of operations recorded a profit of +34.98%, which was one of the best performing signals last week.
· WTI crude oil
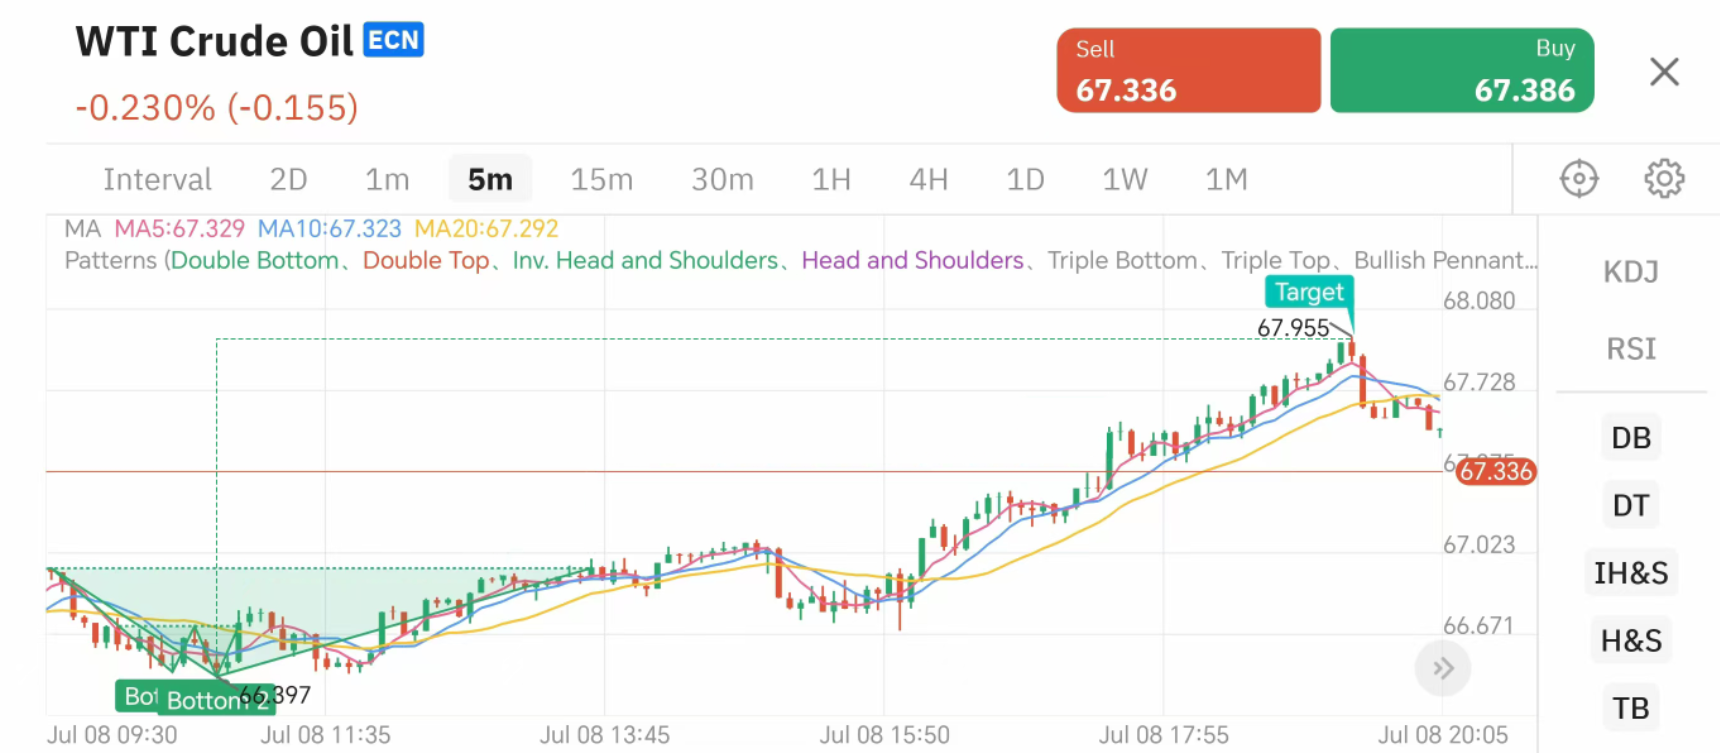
WTI Crude Oil (5-minute chart)
Date: 7/8
Time: 11:00
Pattern: Double bottom
Take Profit: 67.955
Yield: 77.43%
Signal Comments:
At 11:00 on July 8, the closing price formed a [double bottom] and touched the bottom for the second time. The confirmation of the [double bottom] pattern indicated the arrival of an upward trend. After 8.5 hours, the [double bottom] pattern target was achieved, and the stop profit was 67.955. This round of operation recorded a +77.43% return, which was one of the best performing signals last week.
· Bitcoin
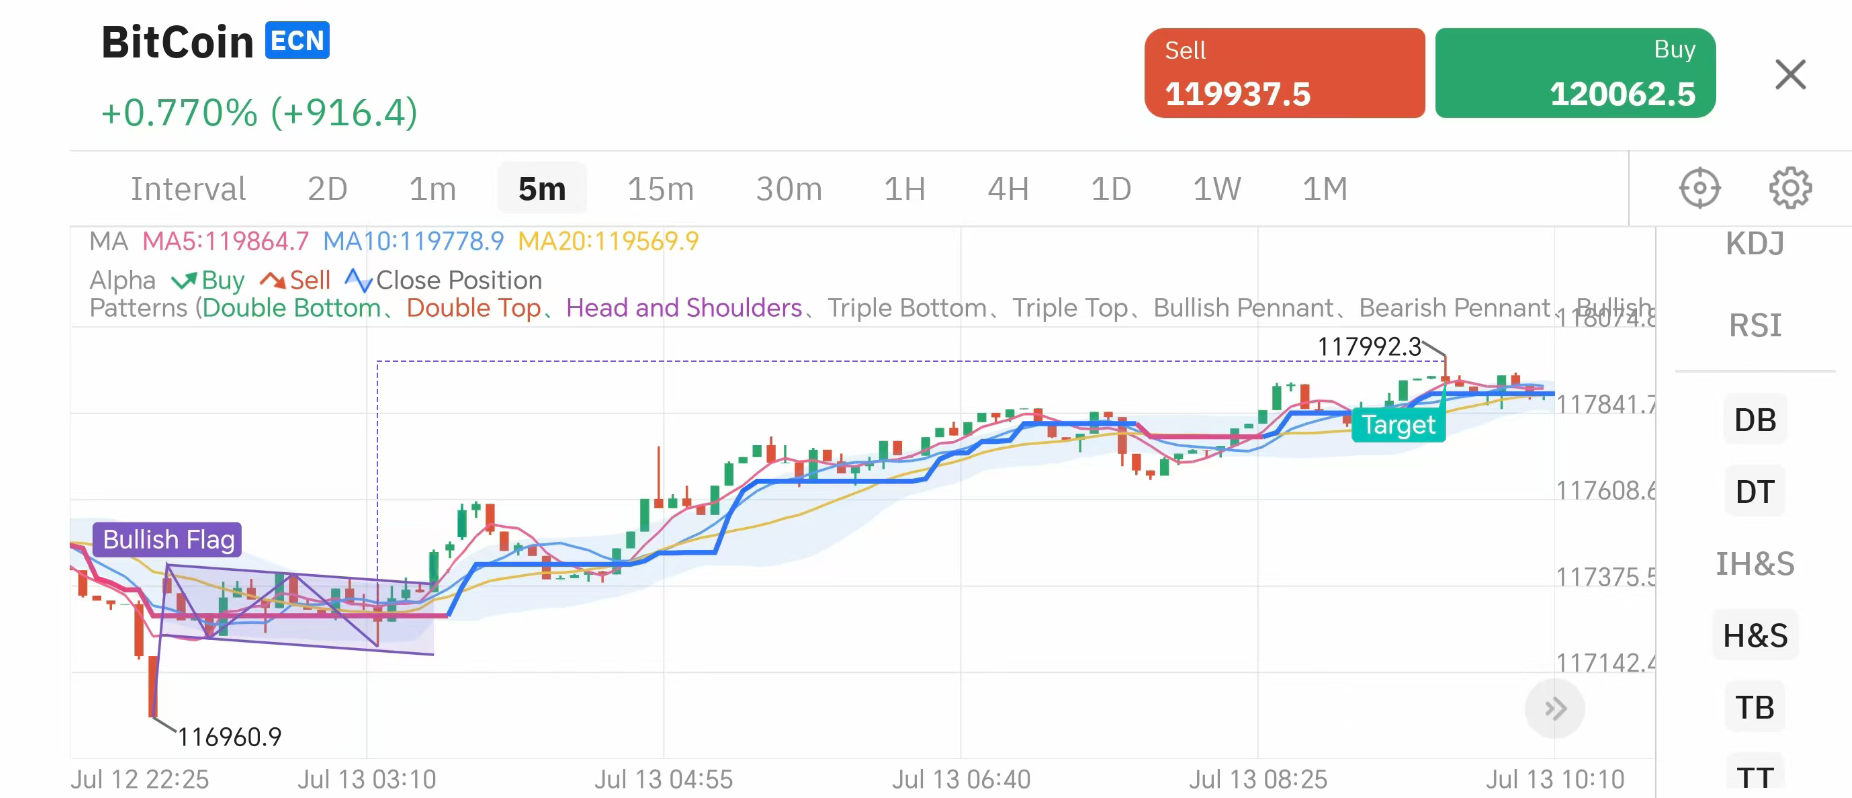
Bitcoin (5-minute chart)
Date: 7/13
Time: 3:15
Pattern: Bullish Flag
Take profit: 117992.3
Yield: 6.11%
Signal Comments:
On 7/13 3:15, the closing price formed a [bullish flag] and bottomed out for the second time. The confirmation of the [bullish flag] pattern indicated the arrival of an upward trend. Six hours later, the [bullish flag] pattern target was achieved, with a take-profit of 117992.3. This round of operations recorded a +6.11% return, which was one of the best performing signals last week.
Weekly Trending Product Analysis
Dow Jones Index
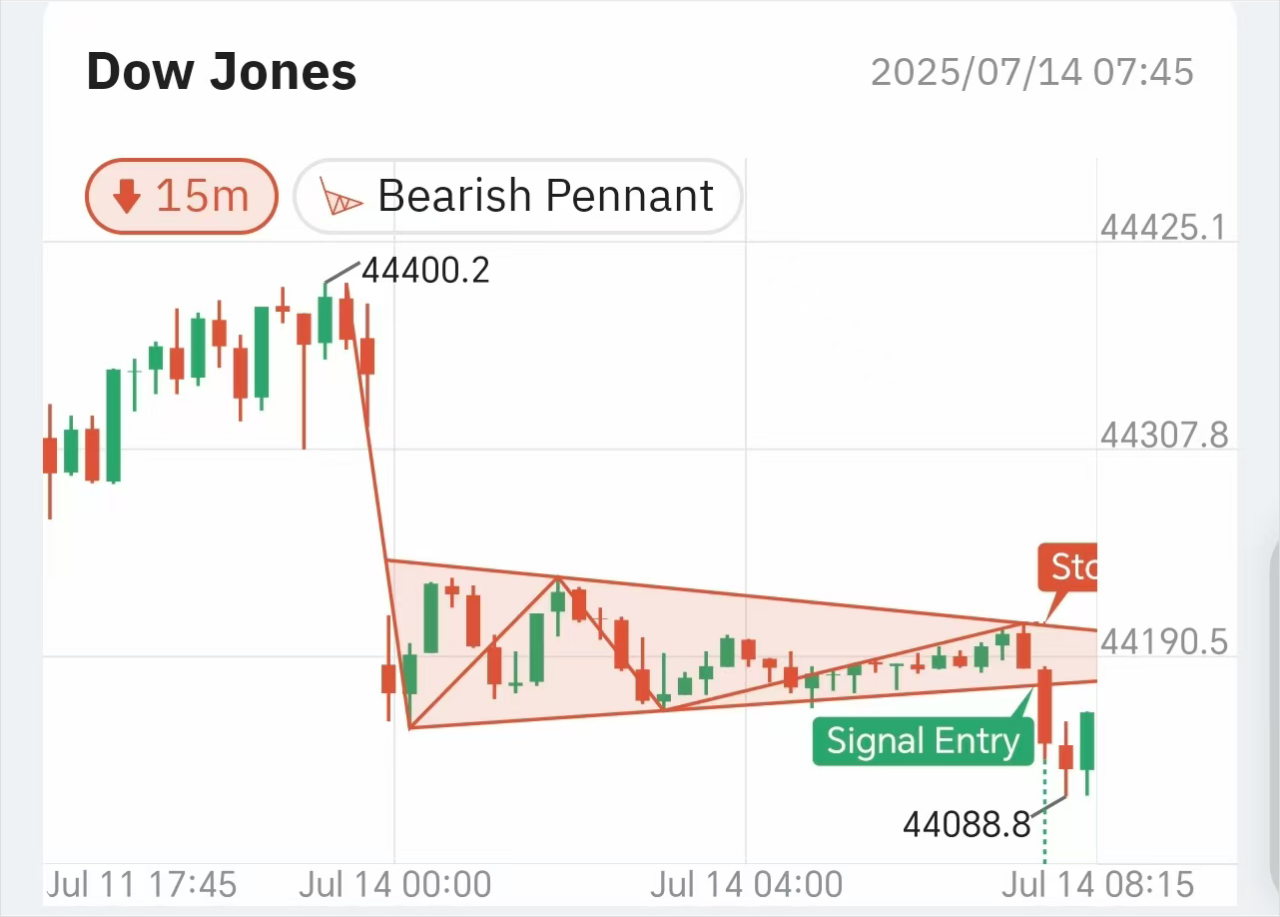
Dow Jones Index (15-minute chart)
Date: 7/14
Time: 8:00
Pattern: Bearish Triangle
Take profit: 43951.9
Yield: 11.26%
Signal Comments:
At 8:00 on July 14, the closing price broke through the neckline, and the confirmation of the [Bearish Triangle] pattern indicated the arrival of a downward trend. You can wait for the market to pull back to near the neckline to enter the market and short, or switch to a smaller cycle and look for opportunities to enter the market and short during a pullback.
Download TOPONE Markets
Download TOPONE Markets
Get the most profitable trading signals first, 1 million traders have downloaded it, and the average daily profit opportunities exceed 200!