English


 Last Week's Performance Analysis
- 1.Continuous upward momentum, gold bottom trend signal brings 102.49% profit potential!
- 2.Fighting for 17.5 hours, the USD/JPY trend signal shows a 30% profit margin!!
Best Performance of Last Week
Alpha trend historical backtracking captures high-confidence signal patterns.
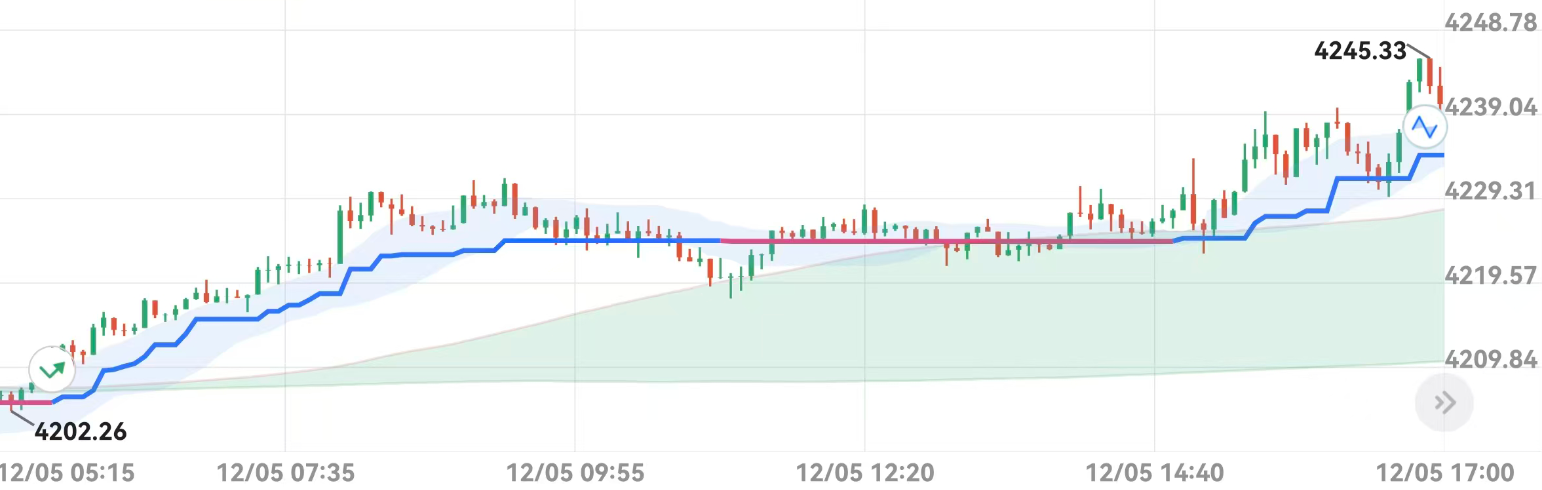
Trend
RiseProfitability 
+102.49%Duration
11.5 hoursSignal Commentary
At 5:30 AM on December 5th, spot gold triggered an Alpha bullish signal at 4202.26 points, leading to a rapid upward trend with strong upward momentum throughout. The Alpha indicator repeatedly confirmed no significant pullback. This round of trading yielded a return of +102.49%, making it one of the best-performing signals of the week.
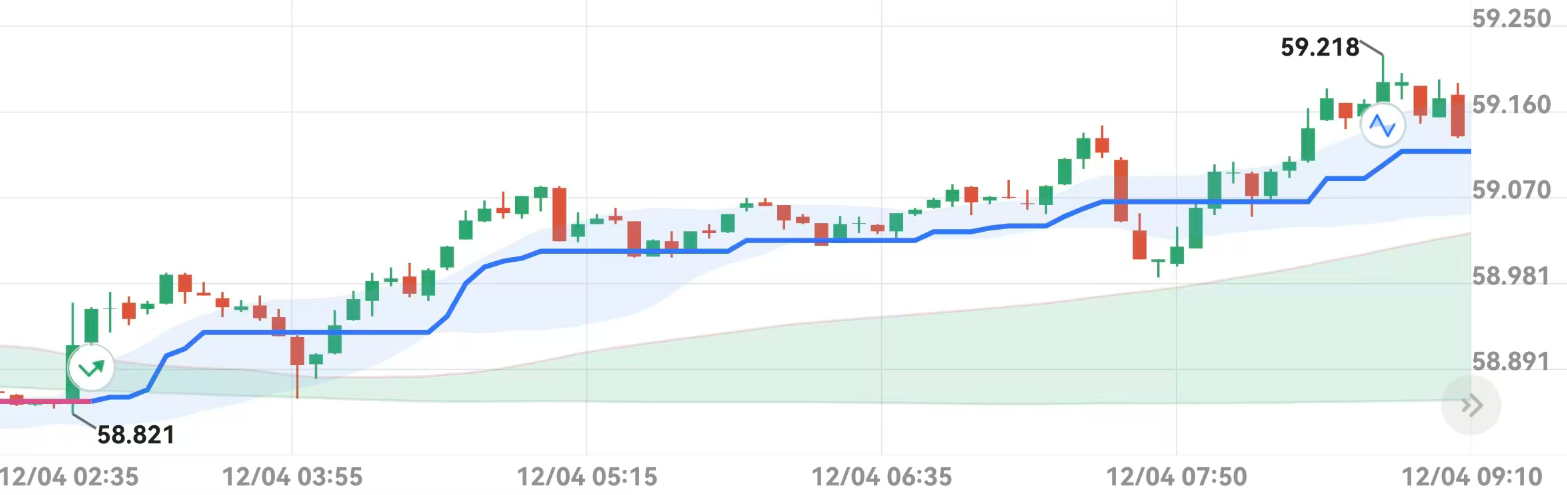
Trend
RiseProfitability
+22.27%Duration
6 hoursSignal Commentary
At 3:00 AM on December 4th, 25th, WTI crude oil triggered an Alpha bullish signal at 58.821 points, leading to a rapid upward trend with strong upward momentum throughout. The Alpha indicator continuously confirmed no significant pullback. This round of trading yielded a +22.27% return, making it one of the best-performing signals of the week.
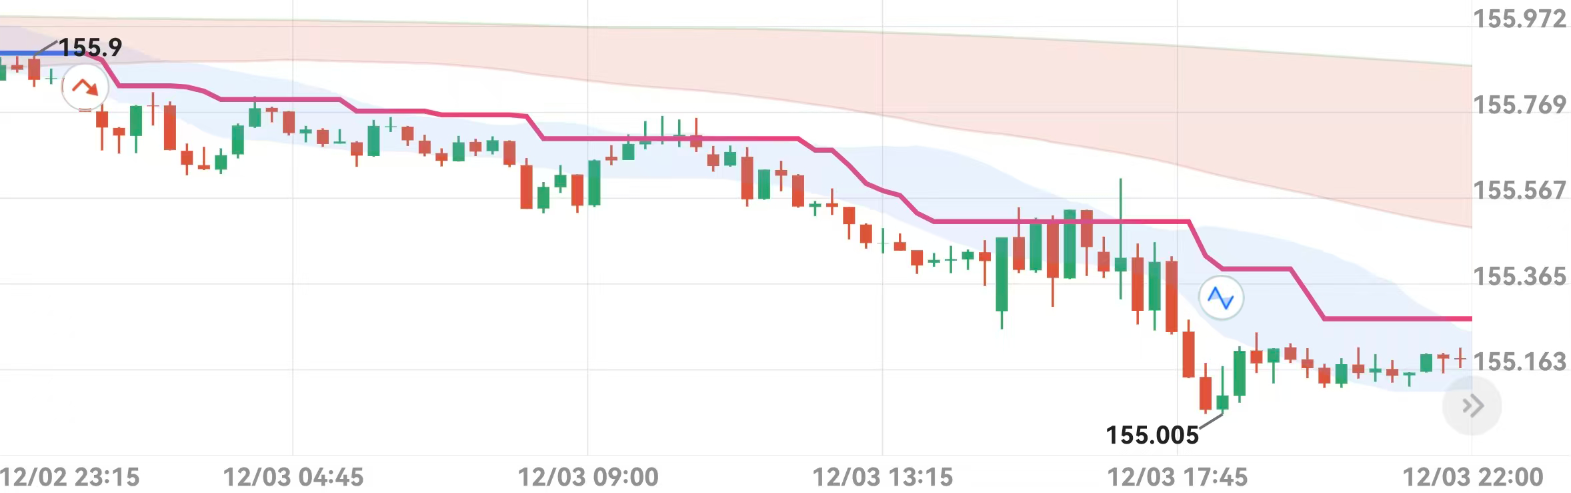
Trend
FallProfitability
+30.25%Duration
17.5 hoursSignal Commentary
At 1:00 AM on December 3, 25th, the USD/JPY pair triggered an Alpha short signal at 155.9, and the trend quickly reversed. The downward momentum was strong throughout, and the Alpha indicator repeatedly confirmed no significant pullback. This trade yielded a +30.25% return, making it one of the best-performing signals of the week.
Hot Opportunities This Week
Monitor multi-timeframe trend resonance and pinpoint key trading signals.
Trend
RiseIncrease/ Decrease %
+0.13%Duration
2 hours 20 minutesOpportunity Analysis
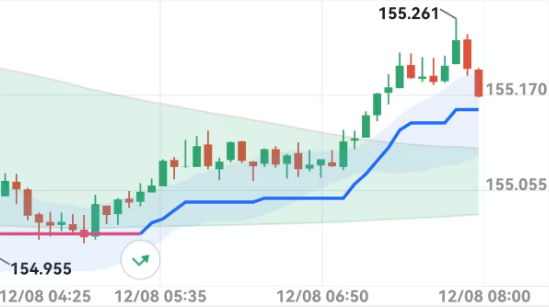
At 5:30 AM on December 8, 25th, the USD/JPY pair is in an uptrend on the 5-minute chart. The MA(80) > MA(480) indicates a long-term uptrend, and the Alpha trendline is turning upwards in the current timeframe, creating a resonance between long and short cycles, confirming an uptrend. In an uptrend, every pullback presents a good opportunity to buy; consider buying on dips.
Review Past Analyses
*Disclaimer
TOPONE Markets' Alpha trend provides only trend-based analysis and does not constitute investment advice or a guarantee of returns. It is recommended to unlock premium access to view the latest trend signals, respond to market changes, and manage risk appropriately.
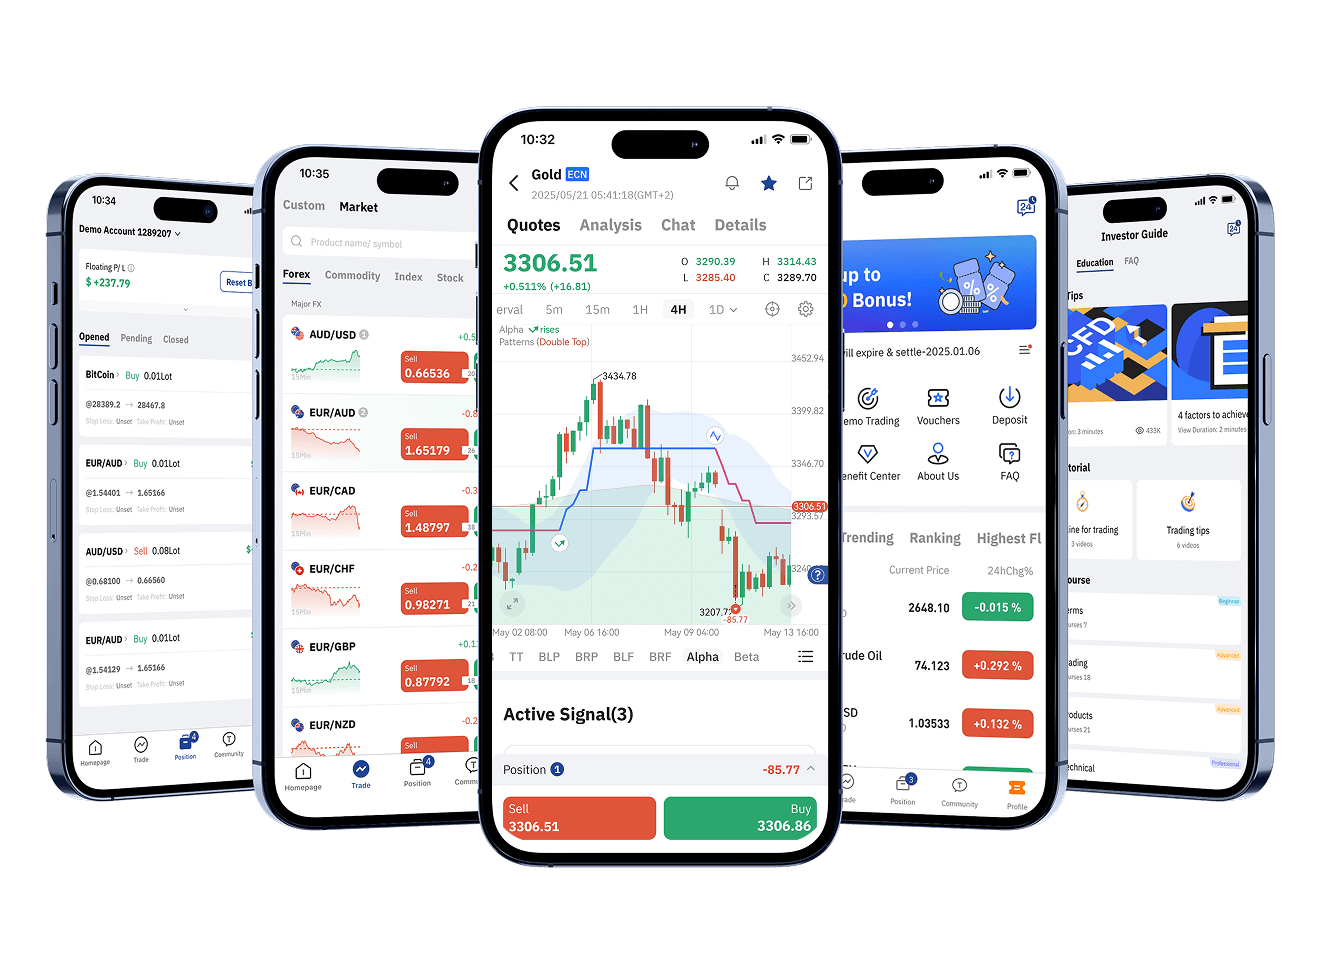
Download TOPONE Markets
Download TOPONE Markets
Get the most profitable trading signals first, 1 million traders have downloaded it, and the average daily profit opportunities exceed 200!