English


 Last Week's Performance Analysis
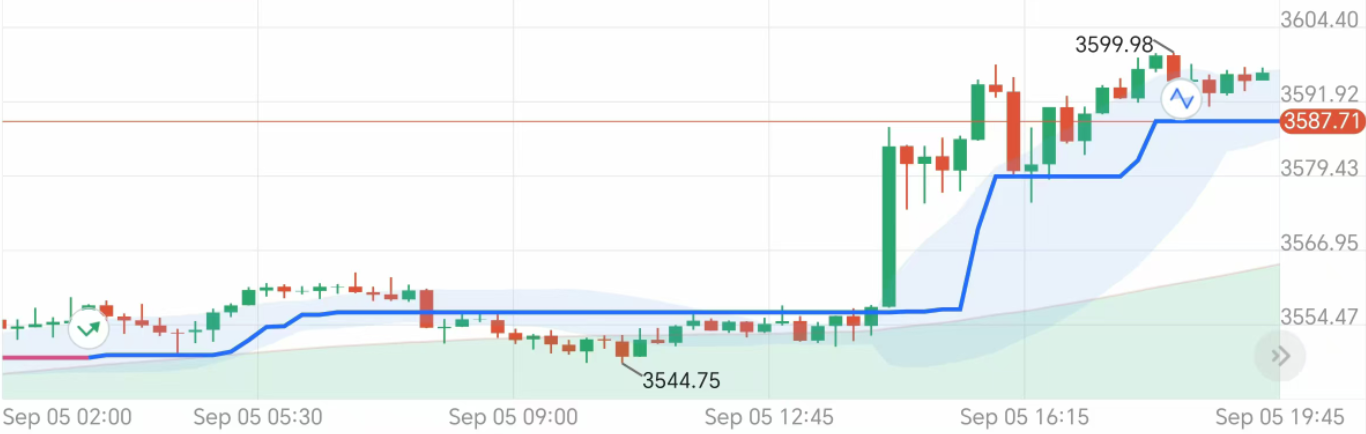
- 1.Gold sideways一字拉升,super profit made 136%!!
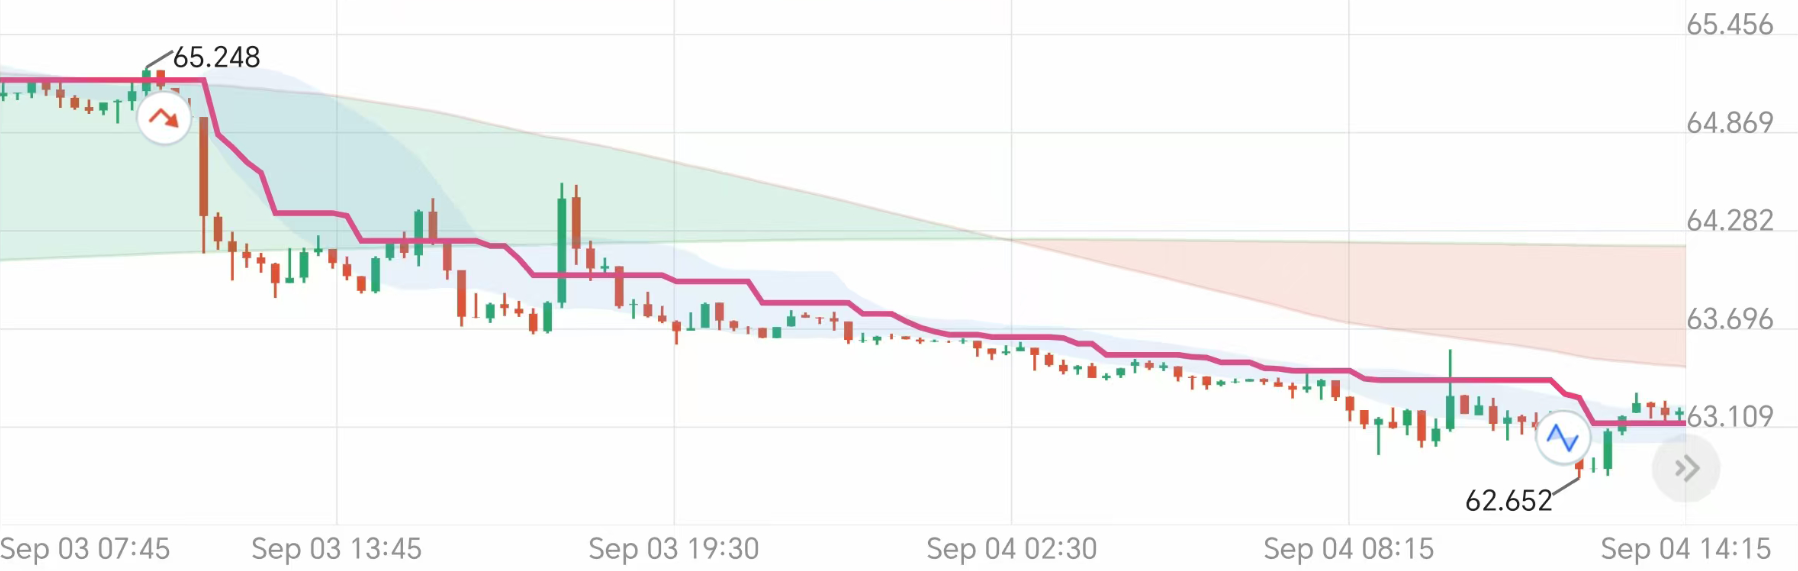
- 2.Crude oil plummeted 26 hours, close your eyes and get 131% profit!
Best Performance of Last Week
Alpha trend historical backtracking captures high-confidence signal patterns.
Trend
RiseProfitability 
+136.82%Duration
18.5 hoursSignal Commentary
At 3:00 AM on September 5, 25th, spot gold triggered an Alpha bullish signal at 3551.39. The trend quickly rose, maintaining strong upward momentum throughout. The Alpha indicator continuously confirmed no significant pullbacks. This round of trading generated a +136.82% return, making it one of the best performing signals of the week.
Trend
FallProfitability
+131.3%Duration
26 hoursSignal Commentary
At 10:30 AM on September 3, 25th, WTI crude oil triggered an Alpha short signal at 65.248. The trend quickly reversed, with strong downward momentum throughout. The Alpha indicator continuously confirmed no significant retracements. This round of trading recorded a +131.30% return, making it one of the best performing signals of the week.
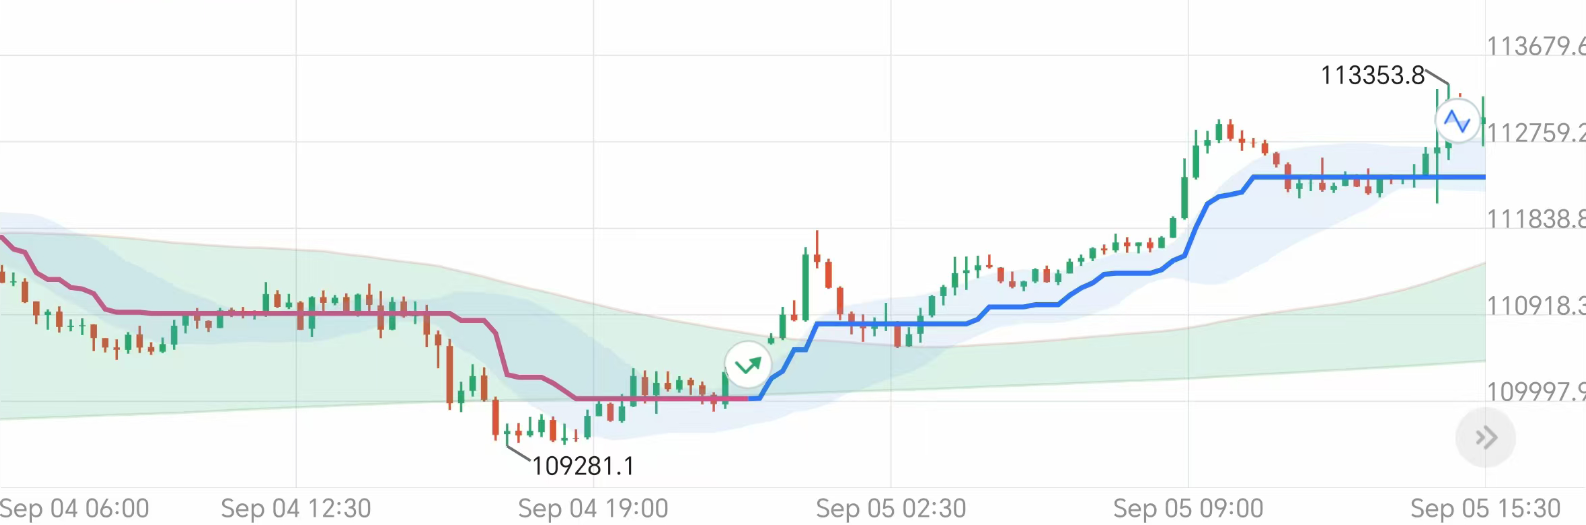
Trend
RiseProfitability
+28.61%Duration
16 hoursSignal Commentary
At 10:30 PM on September 4, 25th, Bitcoin triggered an Alpha bullish signal at 110,200.9. The trend quickly rose, maintaining strong upward momentum throughout. The Alpha indicator continuously confirmed no significant pullbacks. This round of trading generated a +28.61% return, making it one of the best performing signals of the week.
Hot Opportunities This Week
Monitor multi-timeframe trend resonance and pinpoint key trading signals.
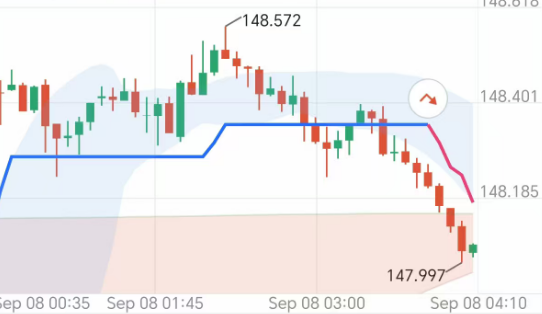
Trend
FallIncrease/ Decrease %
-0.11%Duration
0 hours 15 minutesOpportunity Analysis
USD/JPY is currently in a downtrend on a 5-minute basis. MA (80) > MA (480), indicating a long-term decline. At the same time, the Alpha trendline is turning downward in the current period, creating a resonance between the long and short periods, confirming a downtrend. During a downtrend, every surge in the market is a good opportunity to short, so consider buying at every rally high.
Review Past Analyses
*Disclaimer
TOPONE Markets' Alpha trend provides only trend-based analysis and does not constitute investment advice or a guarantee of returns. It is recommended to unlock premium access to view the latest trend signals, respond to market changes, and manage risk appropriately.
Download TOPONE Markets
Download TOPONE Markets
Get the most profitable trading signals first, 1 million traders have downloaded it, and the average daily profit opportunities exceed 200!