English


Last Week's Performance Analysis
Last Week's Performance Analysis
- 1.26 hours in total, stable profit of 1.5 times!
- 2.Crude oil made a profit of 60.95% in 9 hours
 Alpha trend
· Gold
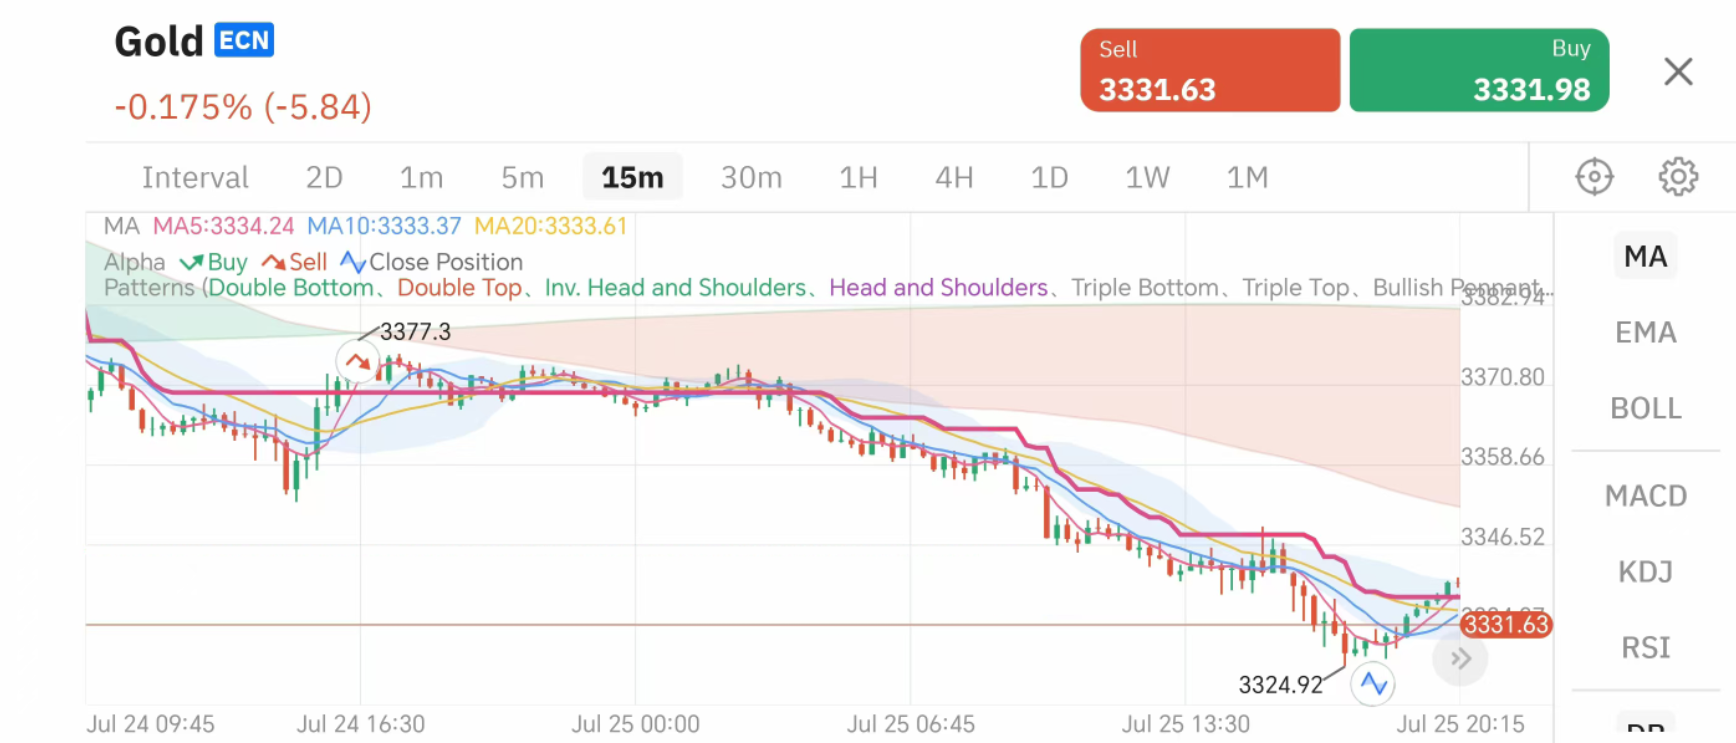
Gold (15-minute chart)
Date: 7/24
Time: 16:30
Trend: Down
Yield: 155.1%
Duration: 26 hours
Signal Comments:
At 16:30 on July 24, spot gold triggered the Alpha short signal at 3377.3 points, and the trend quickly fell back. The downward momentum was strong throughout the whole process, and the Alpha indicator continuously confirmed that there was no obvious retracement. This round of operations recorded a return of +155.1%, which can be regarded as one of the best performing signals last week.
· WTI crude oil
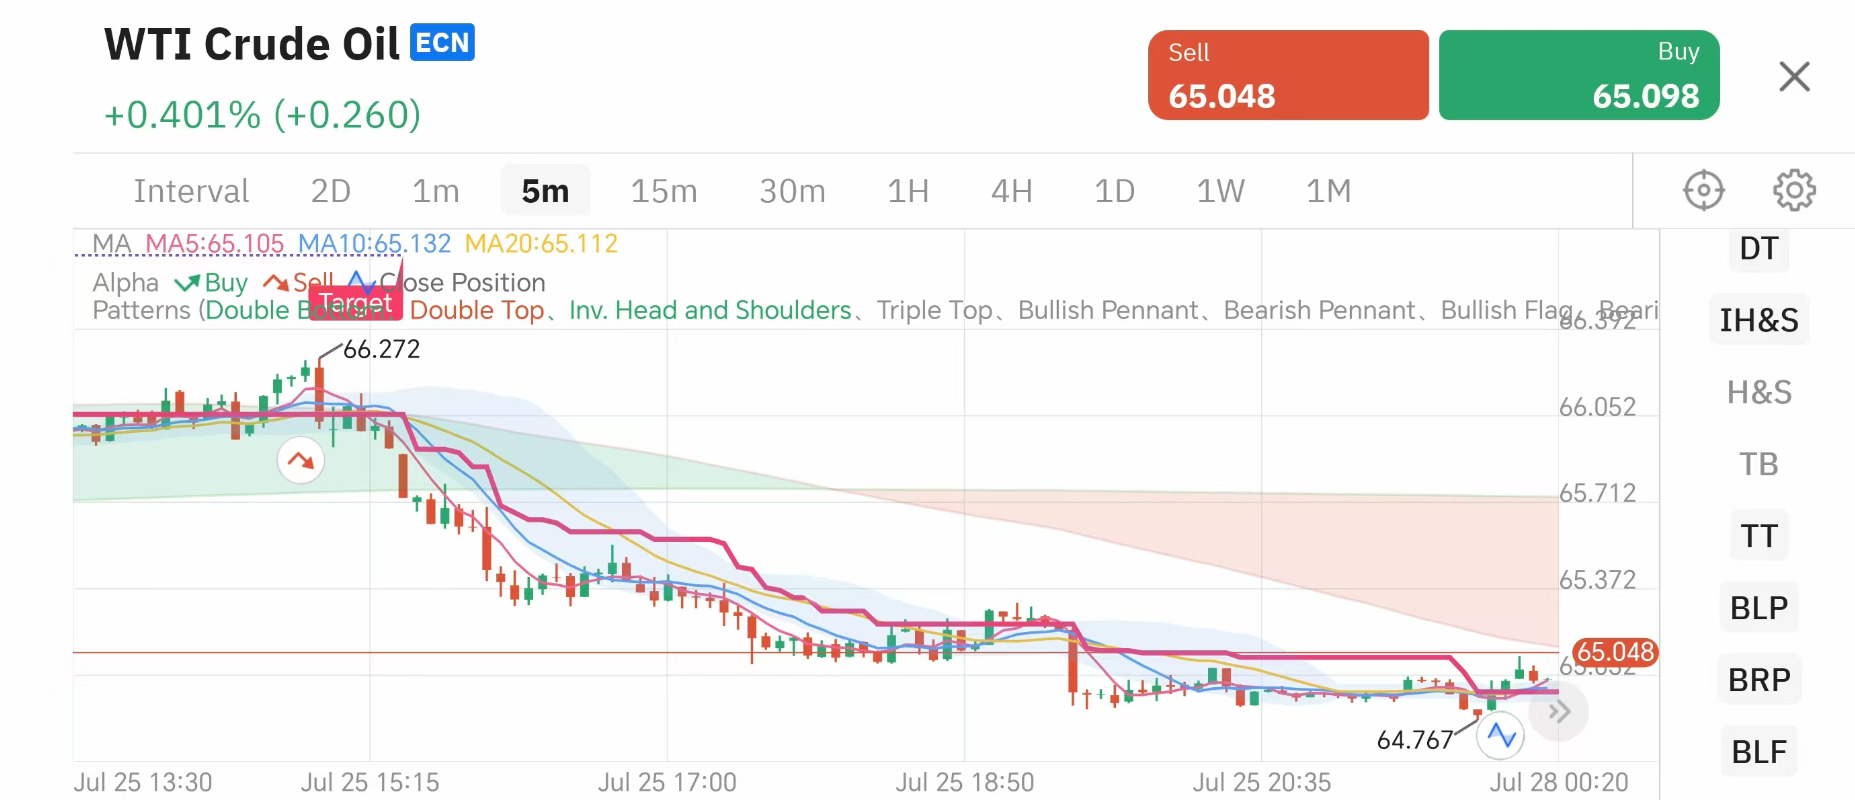
WTI Crude Oil (5-minute chart)
Date: 7/25
Time: 14:55
Trend: Downward
Yield: 60.95%
Duration: 9 hours
Signal Comments:
At 14:55 on July 25, WTI crude oil triggered the Alpha short signal at 66.272 points, and the trend quickly fell back. The downward momentum was strong throughout the process, and the Alpha indicator continuously confirmed that there was no obvious retracement. This round of operations recorded a return of +60.95%, which can be regarded as one of the best performing signals last week.
· Bitcoin
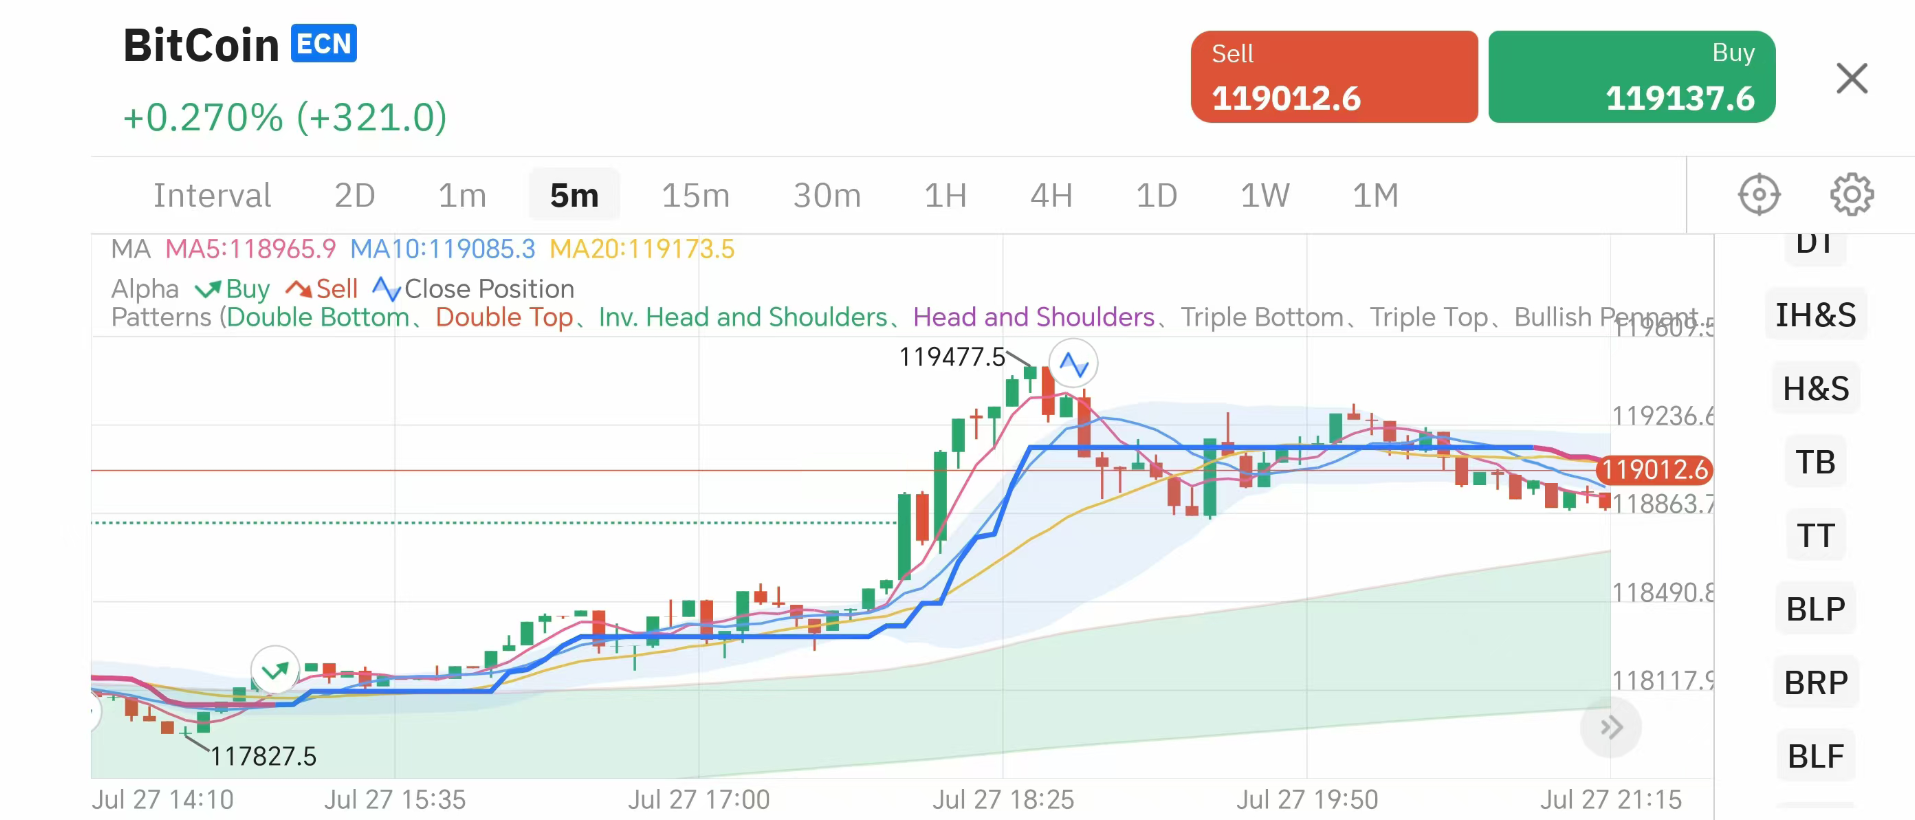
Bitcoin (5-minute chart)
Date: 7/27
Time: 14:40
Trend: Up
Yield: 13.81%
Duration: 4 hours
Signal Comments:
At 14:40 on July 27, Bitcoin triggered the Alpha bull signal at 117827.5 points, and the trend quickly rose. The momentum of the whole rise was strong, and the Alpha indicator continuously confirmed that there was no obvious retracement. This round of operations recorded a +13.81% return, which can be regarded as one of the best performing signals last week.
Weekly Trending Product Analysis
WTI crude oil
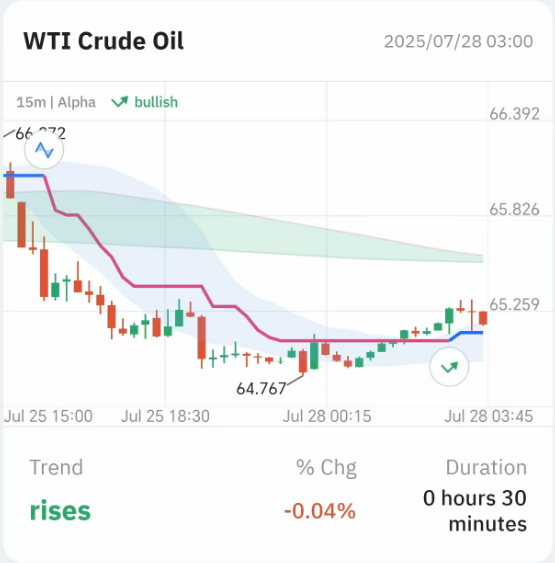
WTI Crude Oil (15-minute chart)
Date: 7/28
Time: 3:00
Trend: Up
Change: -0.04%
Duration: 0 hours 30 minutes
Signal Comments:
Spot gold is in an upward trend in the 15-minute cycle. MA (80) > MA (480) shows a long-term rise. At the same time, the Alpha trend line turns upward in the current cycle, and the long and short cycles form a resonance, confirming an upward trend. In an upward trend, every pullback in the market is a good opportunity to go long, and you can go long on dips.
Download TOPONE Markets
Download TOPONE Markets
Get the most profitable trading signals first, 1 million traders have downloaded it, and the average daily profit opportunities exceed 200!