English


Last Week's Performance Analysis
- The crude oil market exploded! Profits of 93.65% in 9.5 hours!
- USD/JPY hits a historic low! Earn 156,900 points in 14.5 hours!
- The gold market shows an M-top pattern. Seize the opportunity of double tops!
 Quantitative Indicator - USD (Super Trend)
· WTI Crude Oil
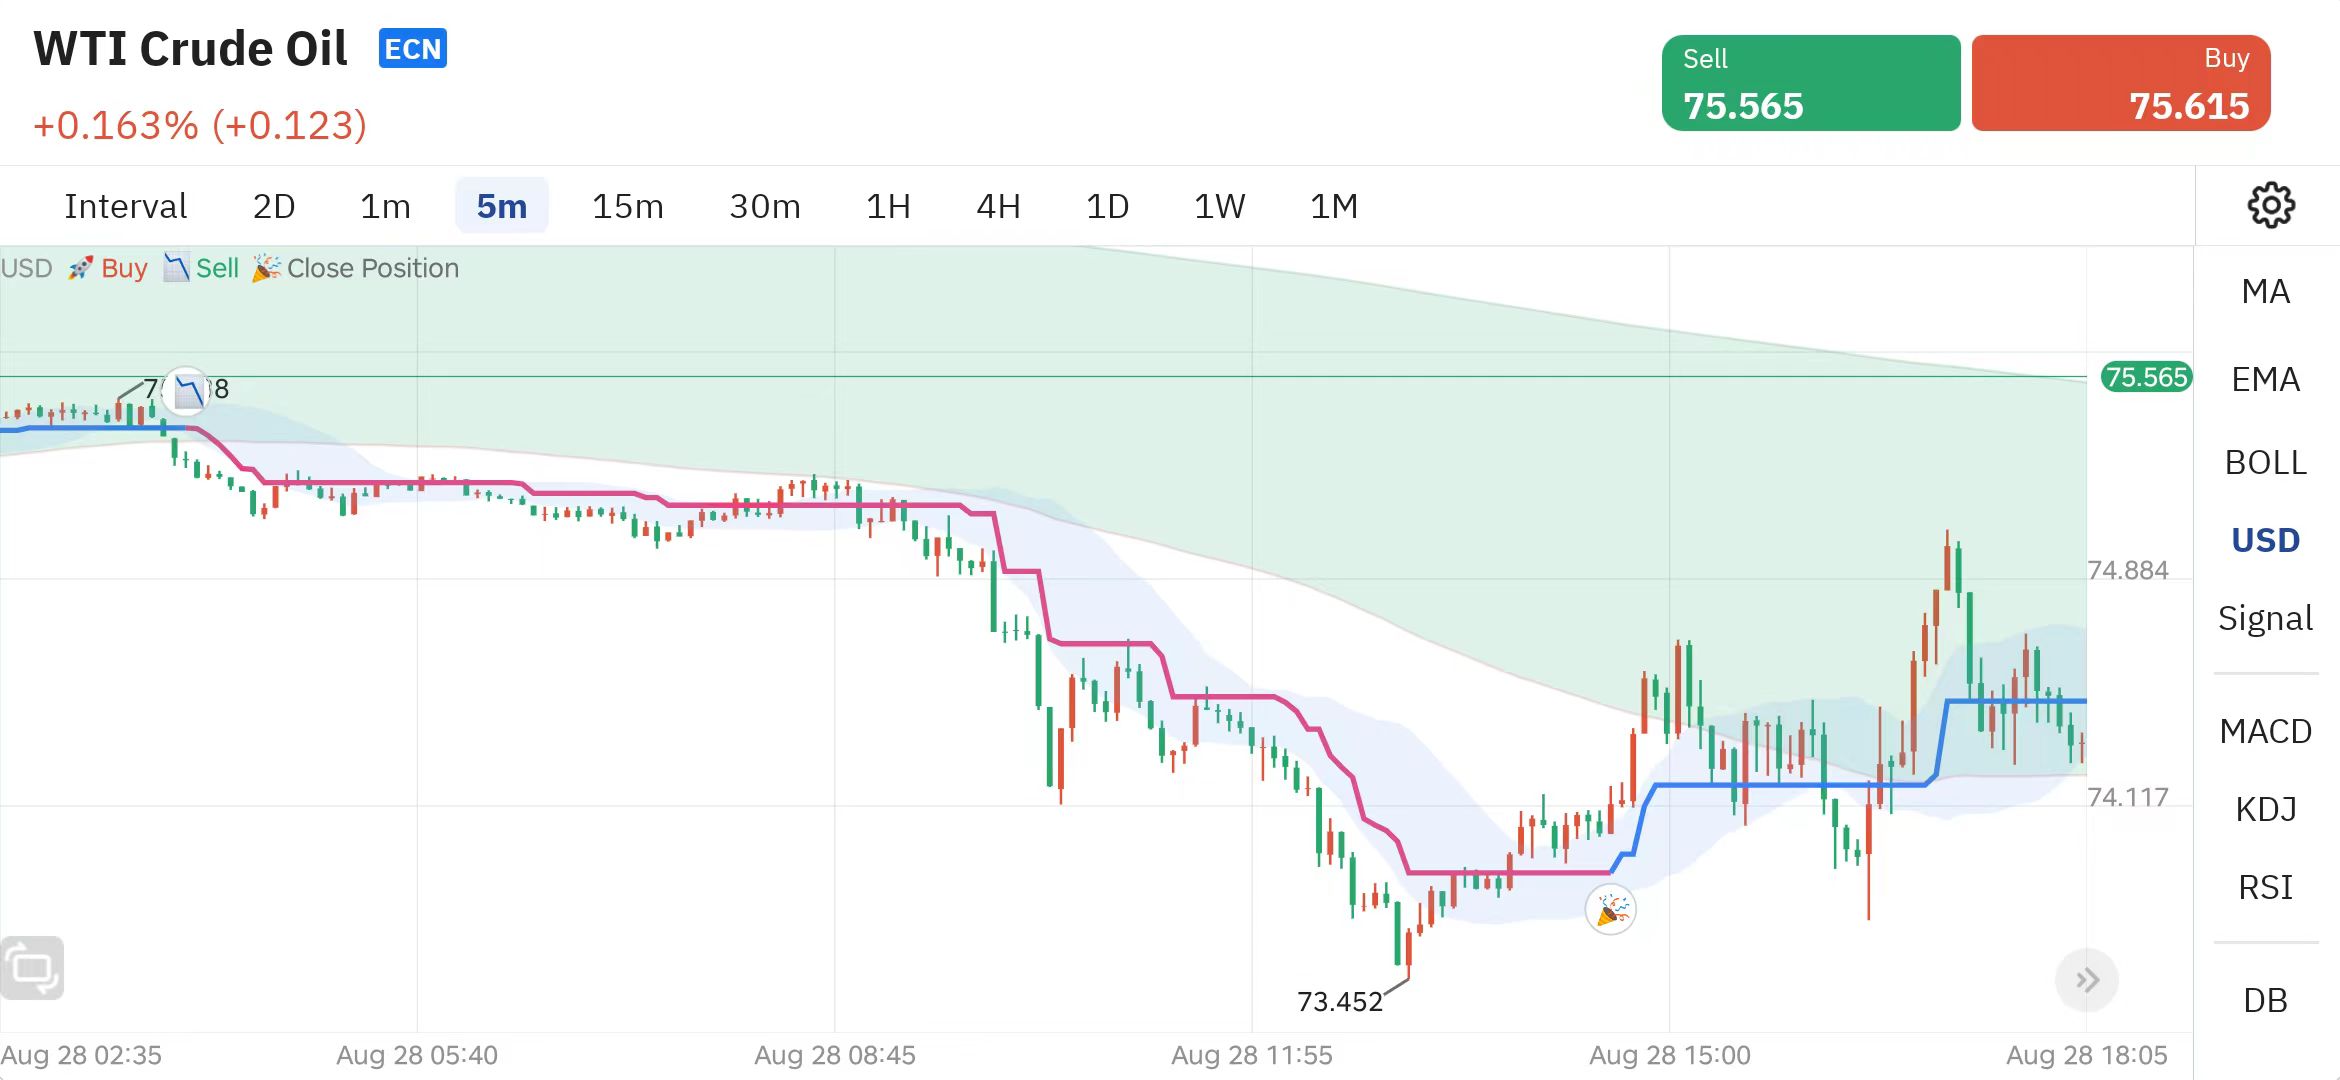
WTI crude oil (5-minute chart)
Last Wednesday, August 28, at 3:30 am, WTI crude oil issued a 📉 signal at 75.488, which indicated that a wave of [bearing trend] was about to form. After that, the price fell all the way. The downward trend continued until 13:05 at noon that day, when the 🎉 signal appeared at 73.452.
The whole process lasted 9 hours and 30 minutes. The span of this wave of operation range, brought by the super trend indicator [USD], was 2036 points. The profit margin reached 93.65%.
Intelligent pattern recognition· USD/JPY
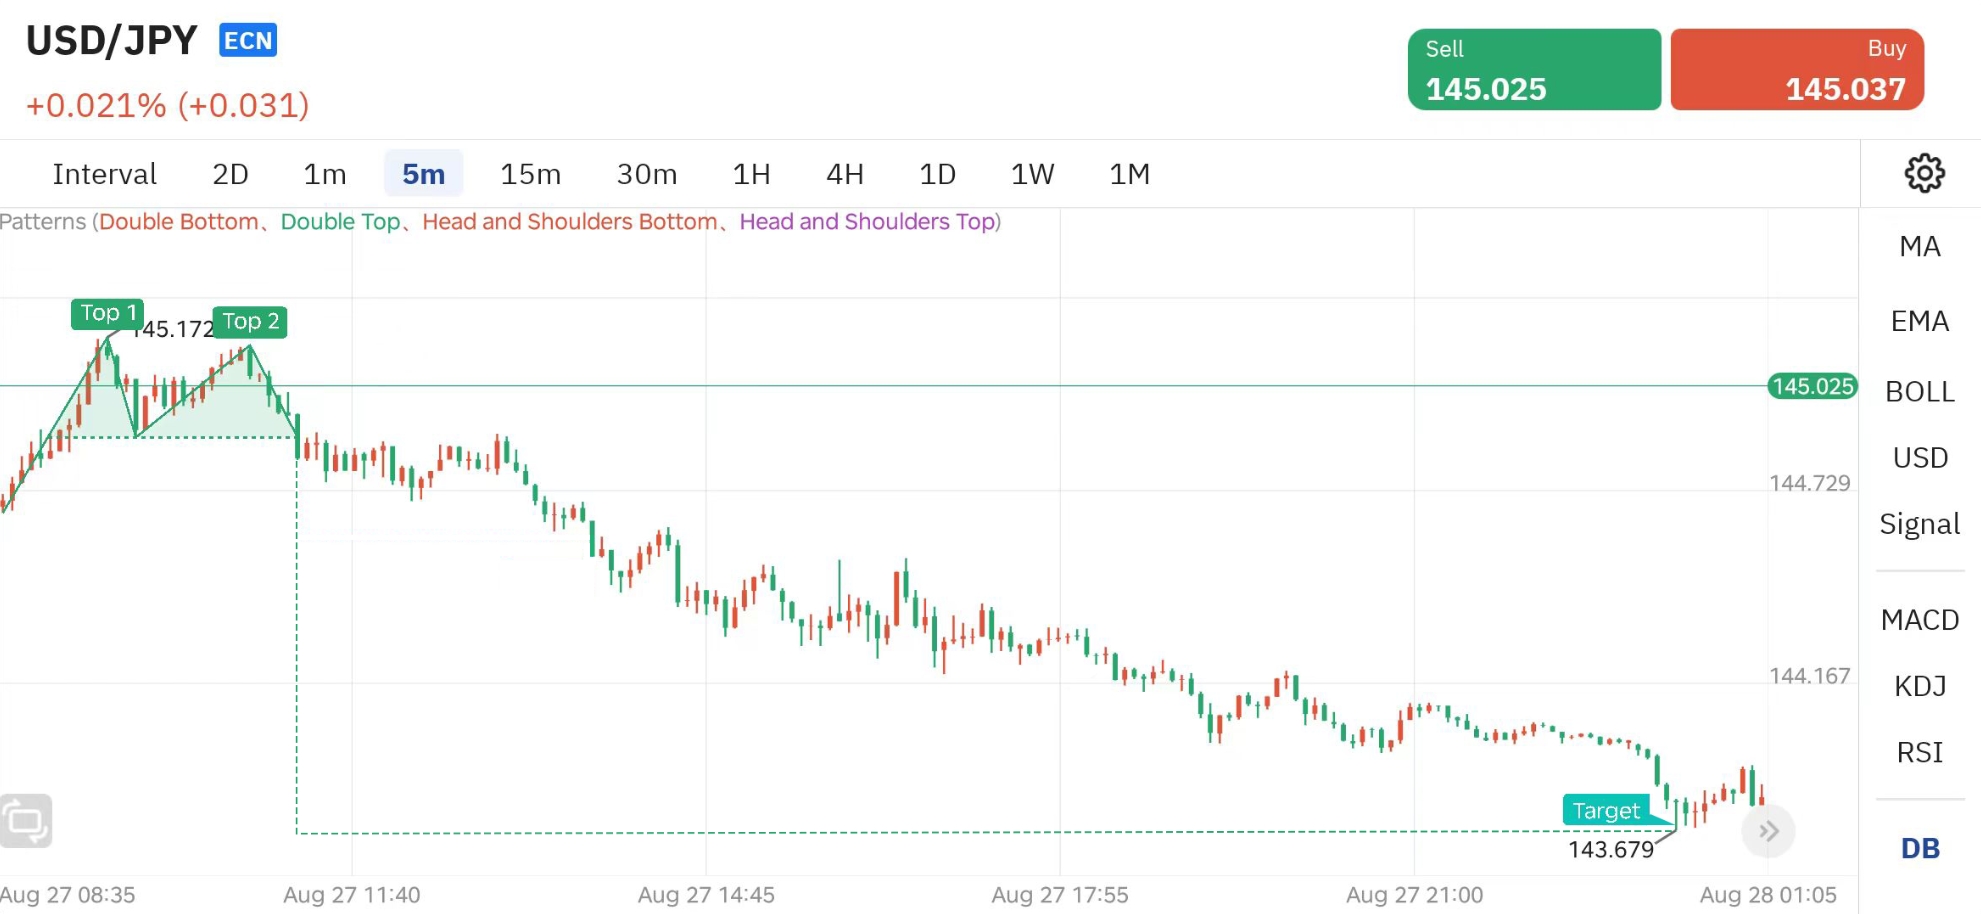
USD/JPY (5-minute chart)
At 9:00 am on August 27, last Tuesday, USD/JPY had a wave of [double top pattern] opportunities.
[The first top] was formed at 9:35, and [the second top] was at 10:50 on the same day. After the second top was formed, it marked the establishment of the [double top pattern]. If we choose to [short] at the [second top] at a price of 145.148.
We can hold this wave of market until 0:00 in the morning of the same day. The system prompts [Target] for us to close the position at a price of 143.679.
From opening to closing, the entire wave of market took 14 hours and 30 minutes. The [double top pattern] signal brought us a profit margin of up to 146,900 points, with a profit rate of 50.3%.
Weekly Trending Product Analysis
GOLD
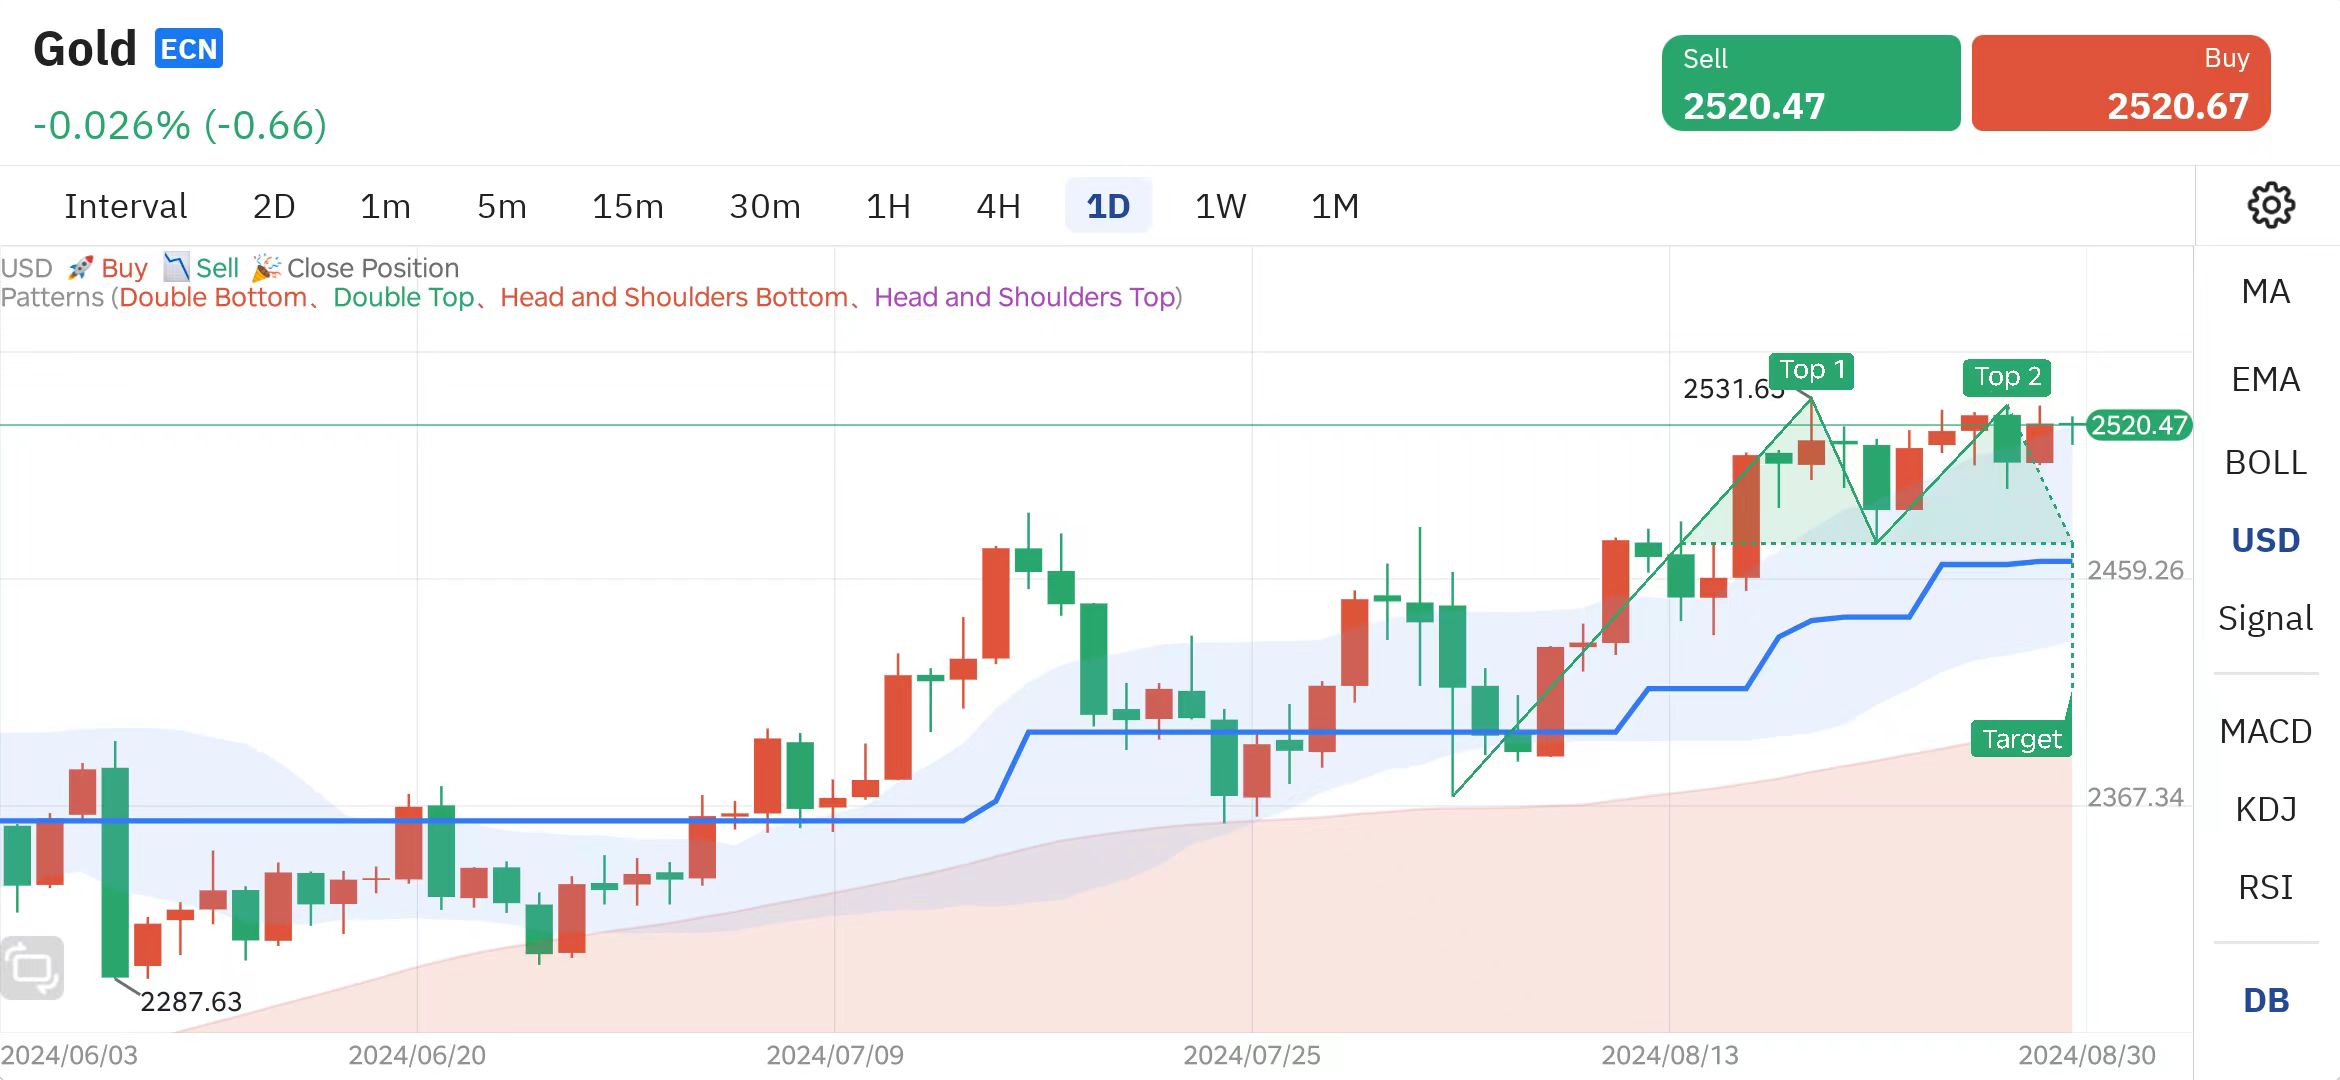
GOLD (Daily Chart)
The current daily K-line chart of the gold market shows a clear [M-shaped double top pattern], which is a technical signal that the gold price may soon enter a downward channel. In order not to miss this potential investment opportunity, I suggest that investors focus on the gold market this week and activate the signal tracking function of the smart assistant. This will help us receive the operation suggestions provided by the software at critical moments, so as to accurately capture the trading opportunities brought by the M-shaped double top pattern.
In terms of specific operation strategies, investors should pay close attention to the formation of the second top and quickly adopt a short-selling strategy after confirming the formation. At the same time, it is also crucial to determine the right time to sell, which will directly affect the maximization of investment returns. With the help of the smart assistant, we can respond to every fluctuation in the market more calmly and ensure rational decisions in a complex and changing trading environment.
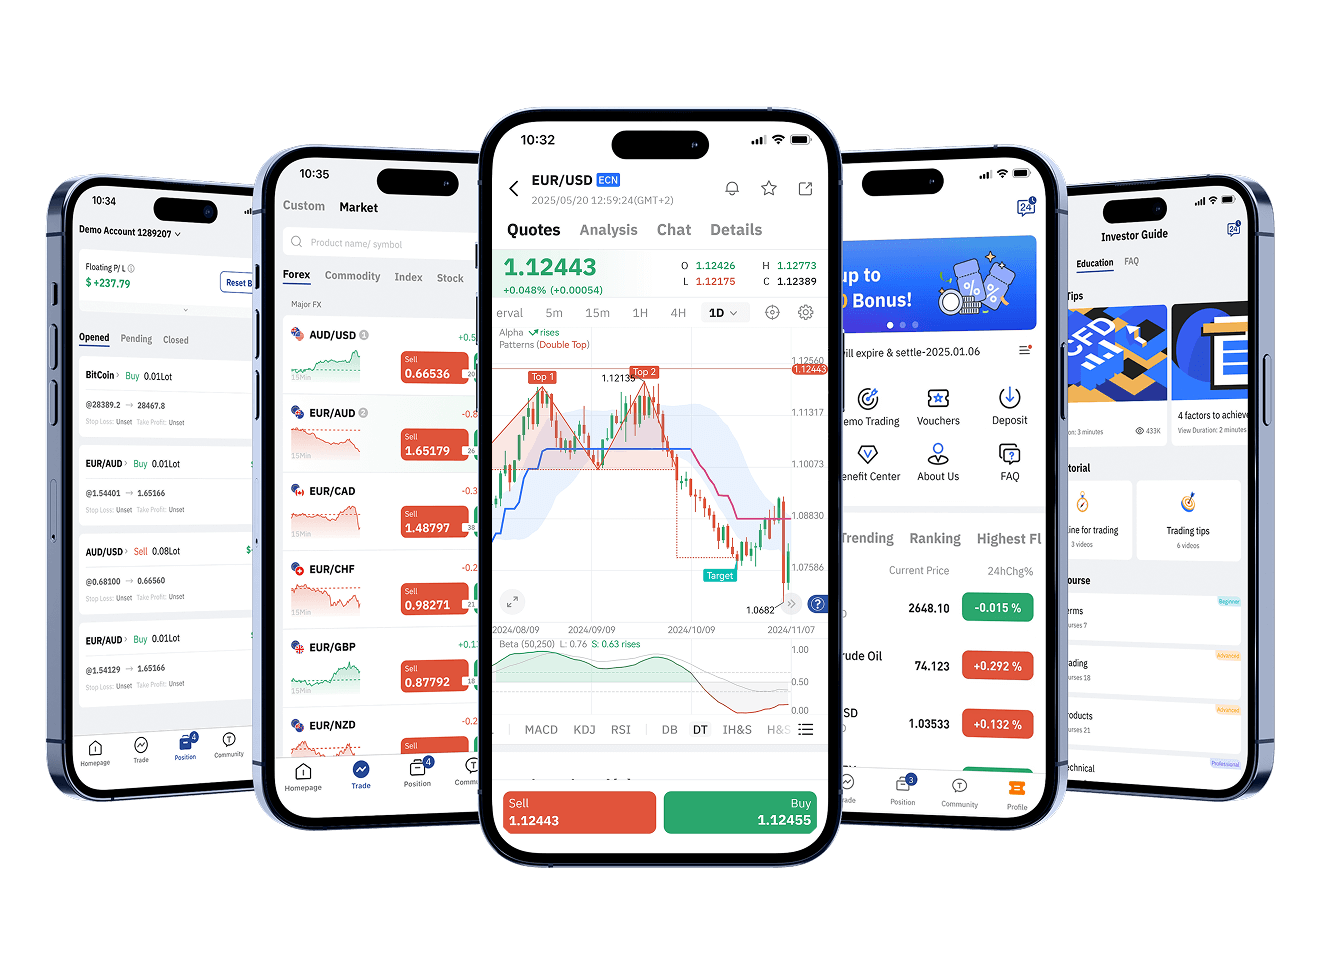
Download TOPONE Markets
Download TOPONE Markets
Get the most profitable trading signals first, 1 million traders have downloaded it, and the average daily profit opportunities exceed 200!