English


Last Week's Performance Analysis
- WTI crude oil: Breaking through a thousand points profit, an investment opportunity not to be missed!
- USD/JPY gained 71.35% in 9 hours!
- Euro/USD: A market move is imminent, seize the moment!
 Quantitative Indicator - USD (Super Trend)
· WTI Crude Oil
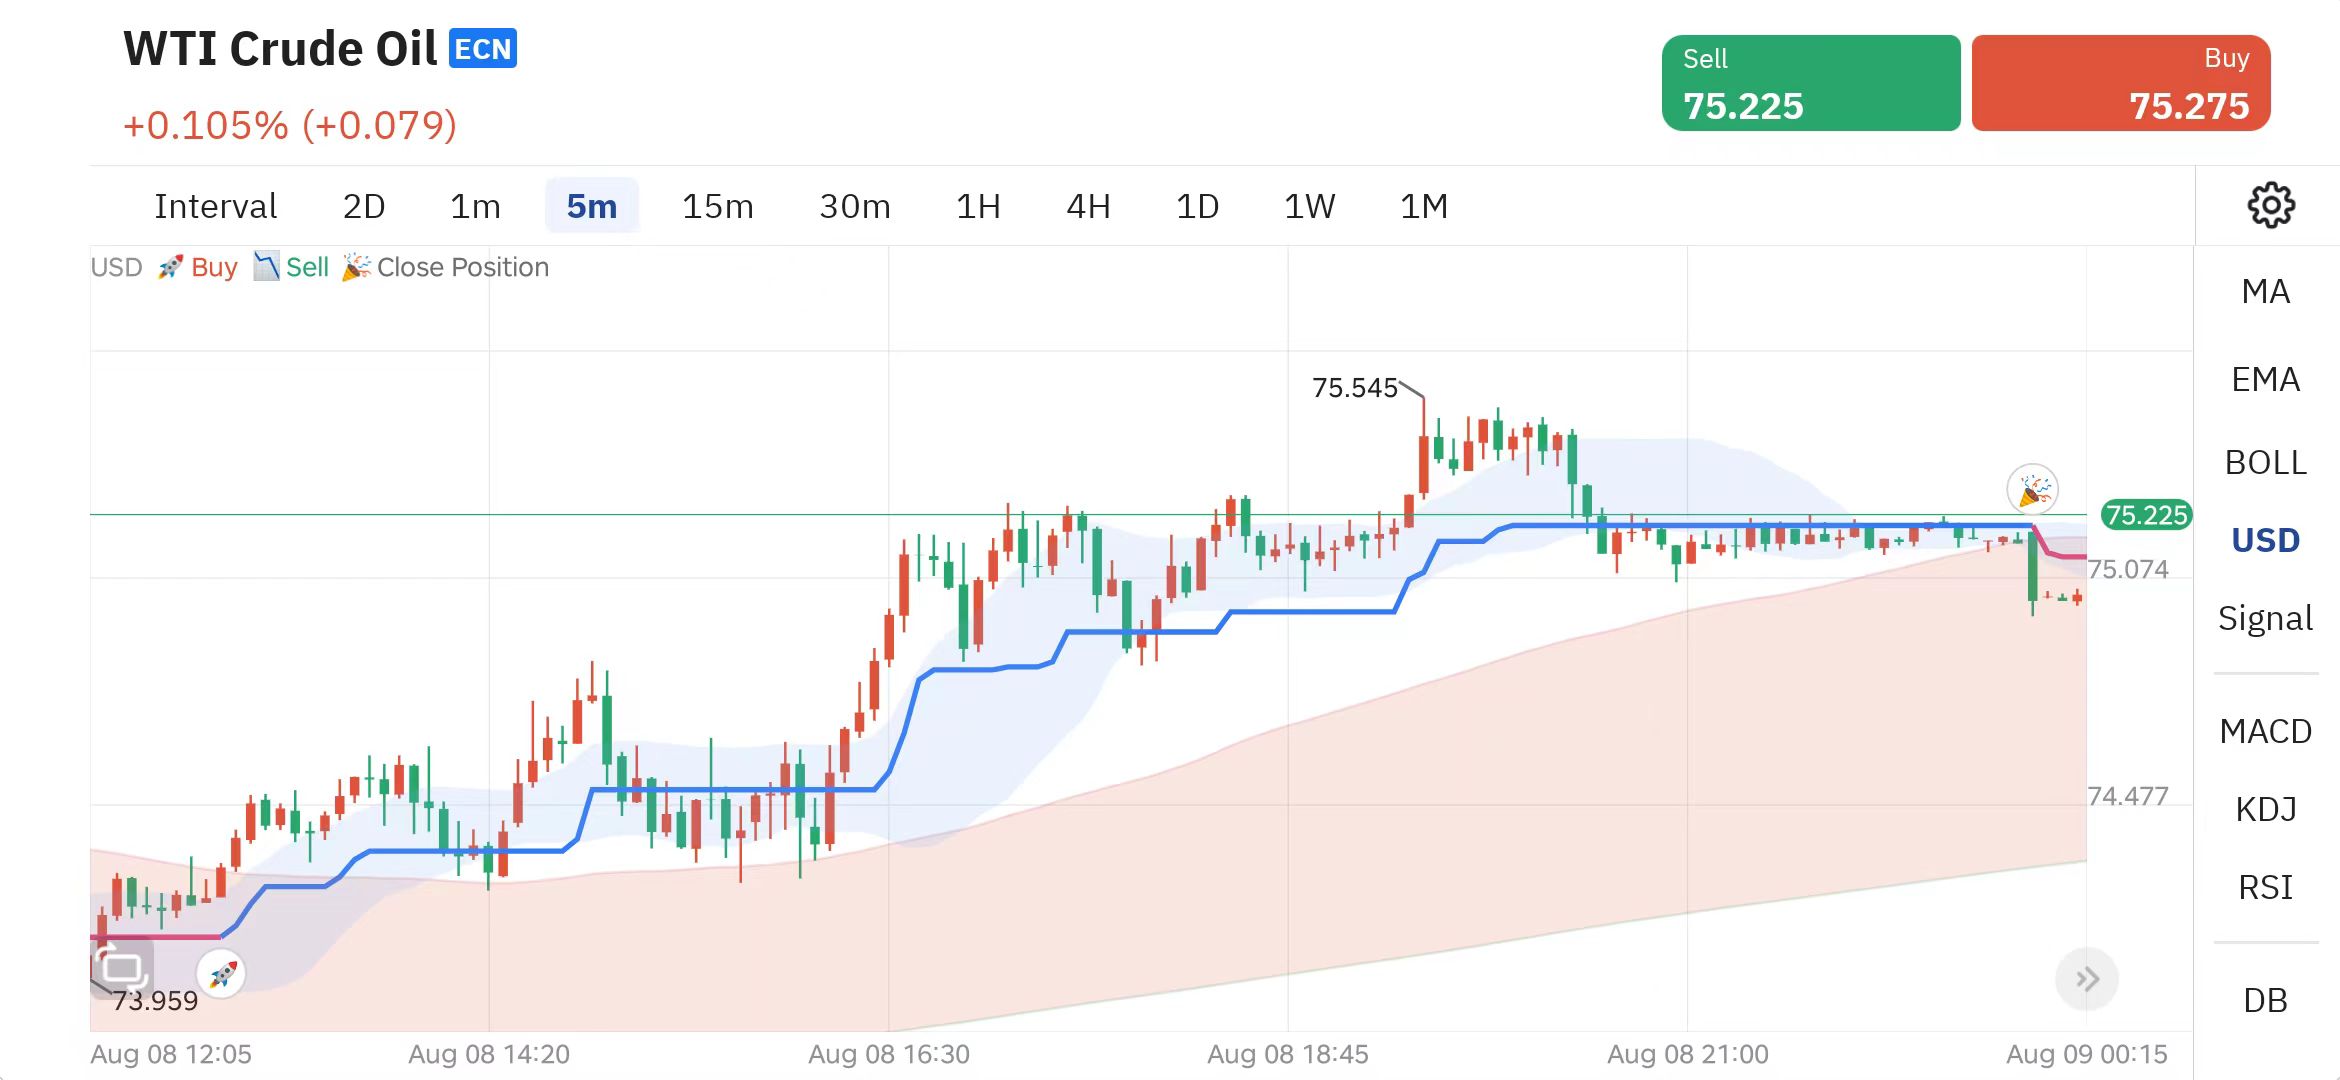
WTI Crude Oil (5-minute chart)
At 12:50 noon on August 8 last Thursday, the software sent a 🚀 signal at the 74.179 position in WTI crude oil products, which marked the formation of a [bullish trend]. The trend continued until the 🎉 signal appeared at 75.178 at 0:00 that night, which also meant the end of the entire [bull trend].
In the past 12 hours, the super trend indicator [USD] has brought us an operating range of 1,000 points. It brings a profit margin of 44.32%.
Intelligent pattern recognition· USD/JPY
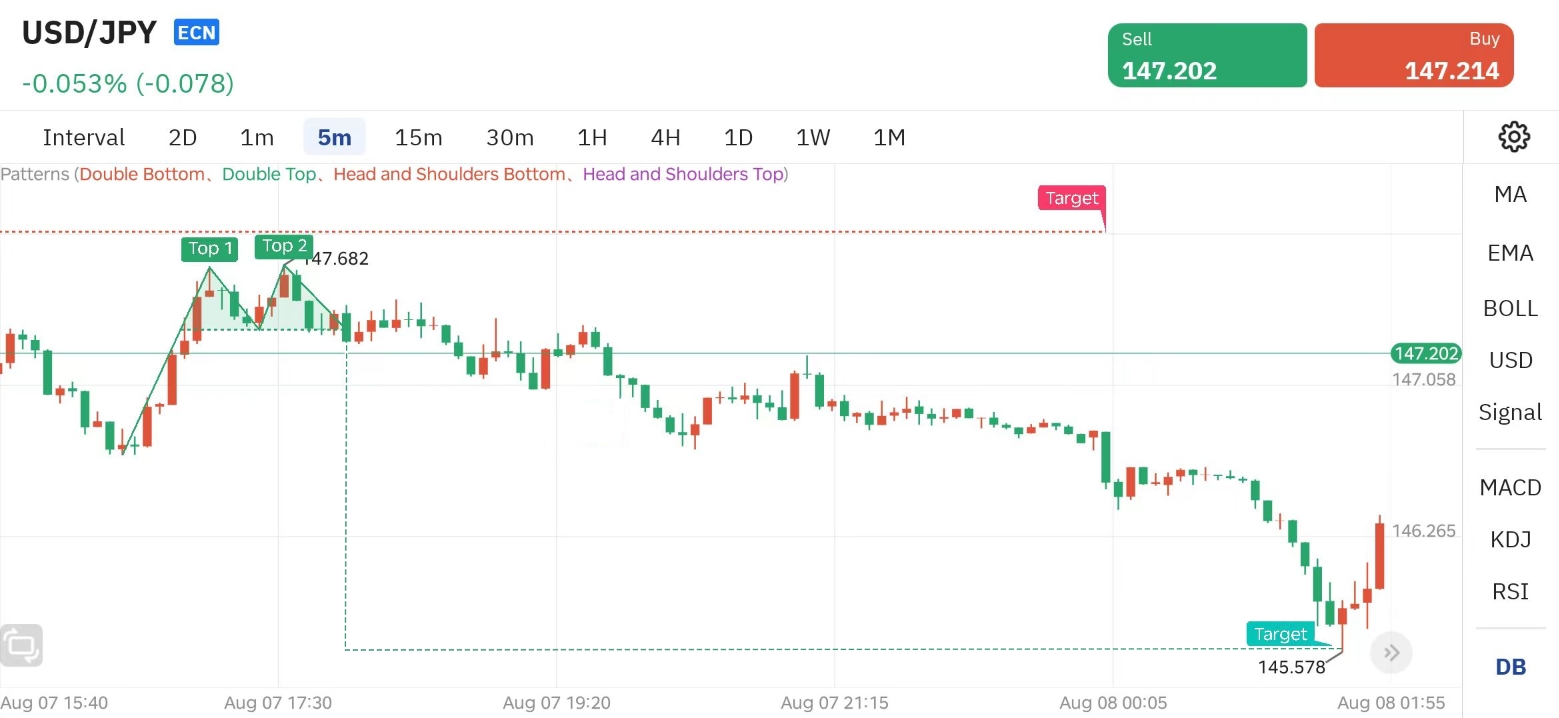
USD/JPY (5-minute chart)
[Double top pattern] started at 16:55 pm on August 7 last Wednesday.
Ten minutes later, at 17:05, we observed the [first top] forming. Then another 30 minutes later, at 17:35, the [second top] was formed, marking the establishment of the [double top pattern]. We then decisively [short] at the [second top] price of 147.682.
At 2:45 in the morning on August 8, the system prompted that the [Target] target was reached, and we [closed the position] at the price of 145.578.
After 9 hours, the [double top pattern] signal brought us 2104 points of space, with a profit margin of 71.35%.
Weekly Trending Product Analysis
EUR/USD
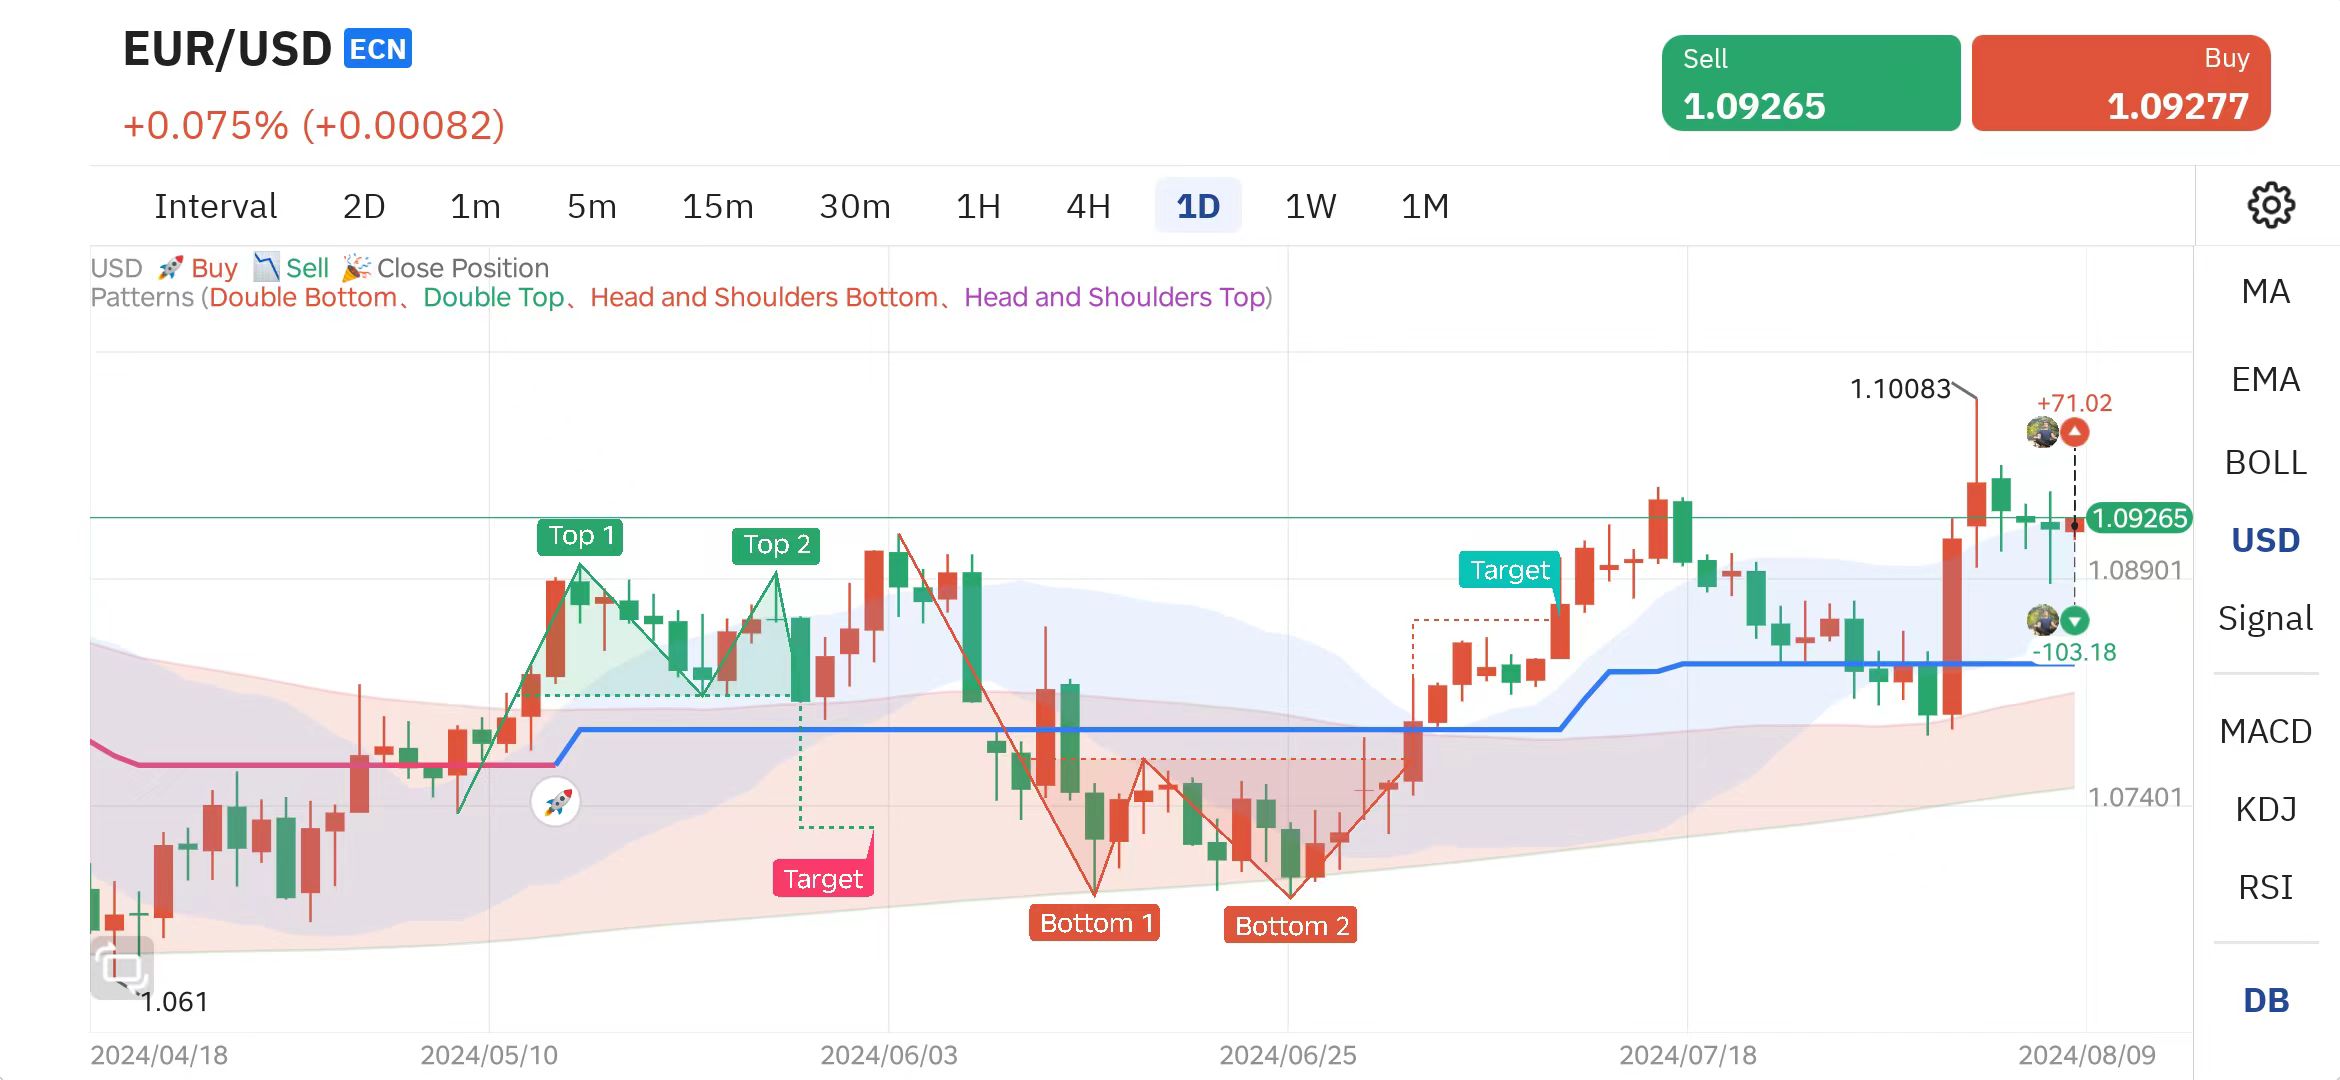
EUR/USD (daily chart)
Through research, we can clearly see that the current EUR/USD is still in an upward trend, and the [Rocket] trend state is not over yet. At the same time, we can see that the [double top] and [double bottom] patterns have completed the form transformation.
Is the current position still within the upward breakthrough range formed by the [double bottom], or has it broken away from the shackles of the [double bottom] form and is re-forming a new form? This requires us to include the trend next week for analysis before we can draw a conclusion.
Will the trend next week continue the upward trend or take a new form? What opportunities will it bring to us? All of this requires us to make good use of the characteristics of the tools. I recommend that investors use the [Smart Assistant] next week to include EUR/USD as a key focus and enable the signal tracking function. This ensures that we can receive operating instructions from the software in a timely manner and seize every investment opportunity.
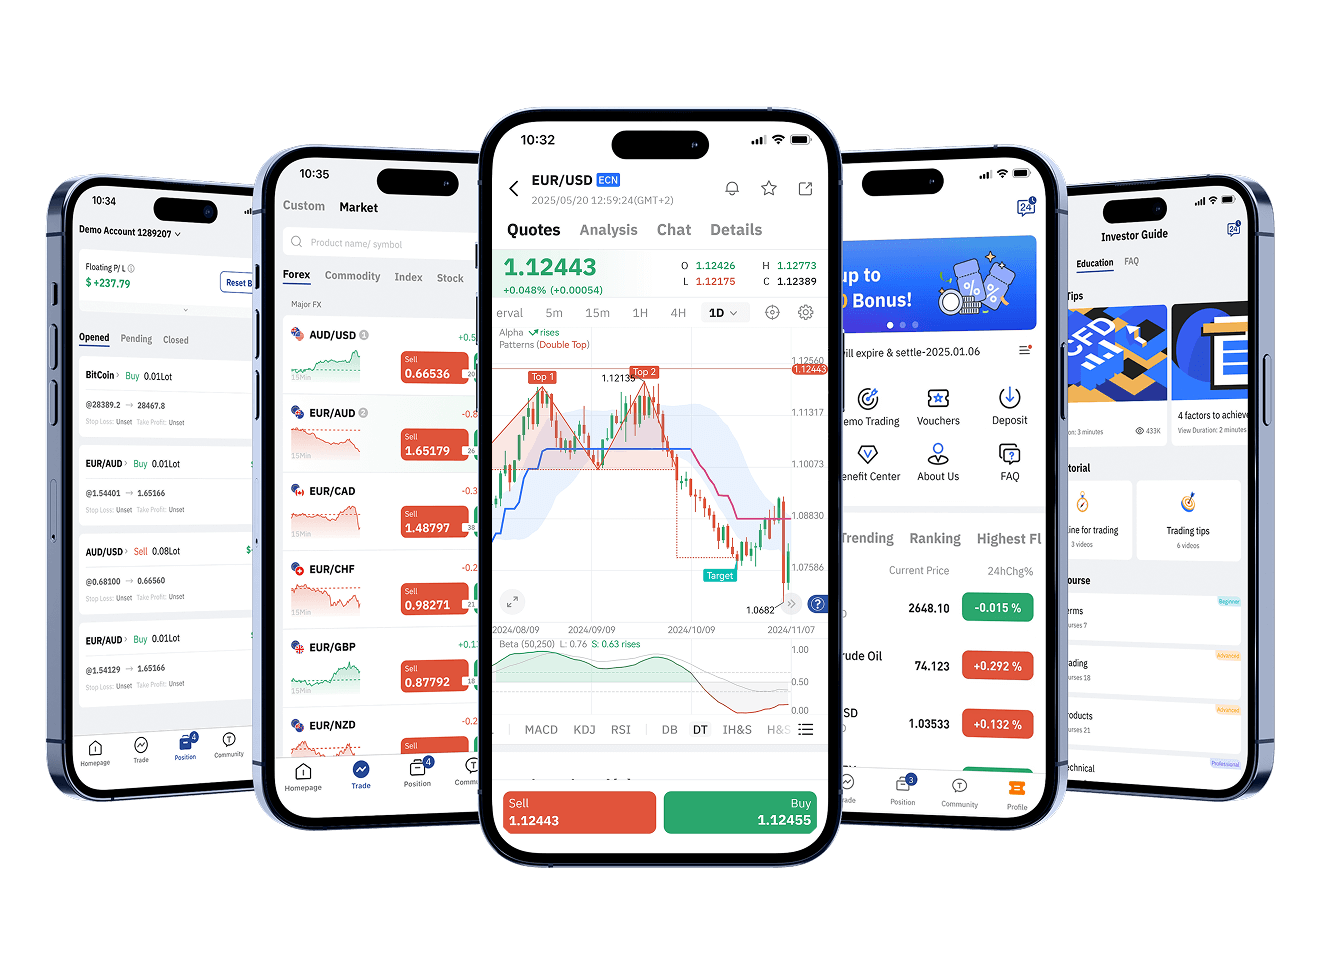
Download TOPONE Markets
Download TOPONE Markets
Get the most profitable trading signals first, 1 million traders have downloaded it, and the average daily profit opportunities exceed 200!