English


Last Week's Performance Analysis
- Uncovering the GBP/USD Trading Signals: Capture 582 Pips of Profit and a 45% Return on Investment!
- Speed Win Strategy: WTI Crude Oil Double Top, Capturing 16.65% Profit in 40 Minutes!
- 91% Profit Explosion: Gold's Double Bottom Formation, Achieving Wealth and Dreams in 1.5 Hours!
 Quantitative Indicator - USD (Super Trend)
· GBP/USD
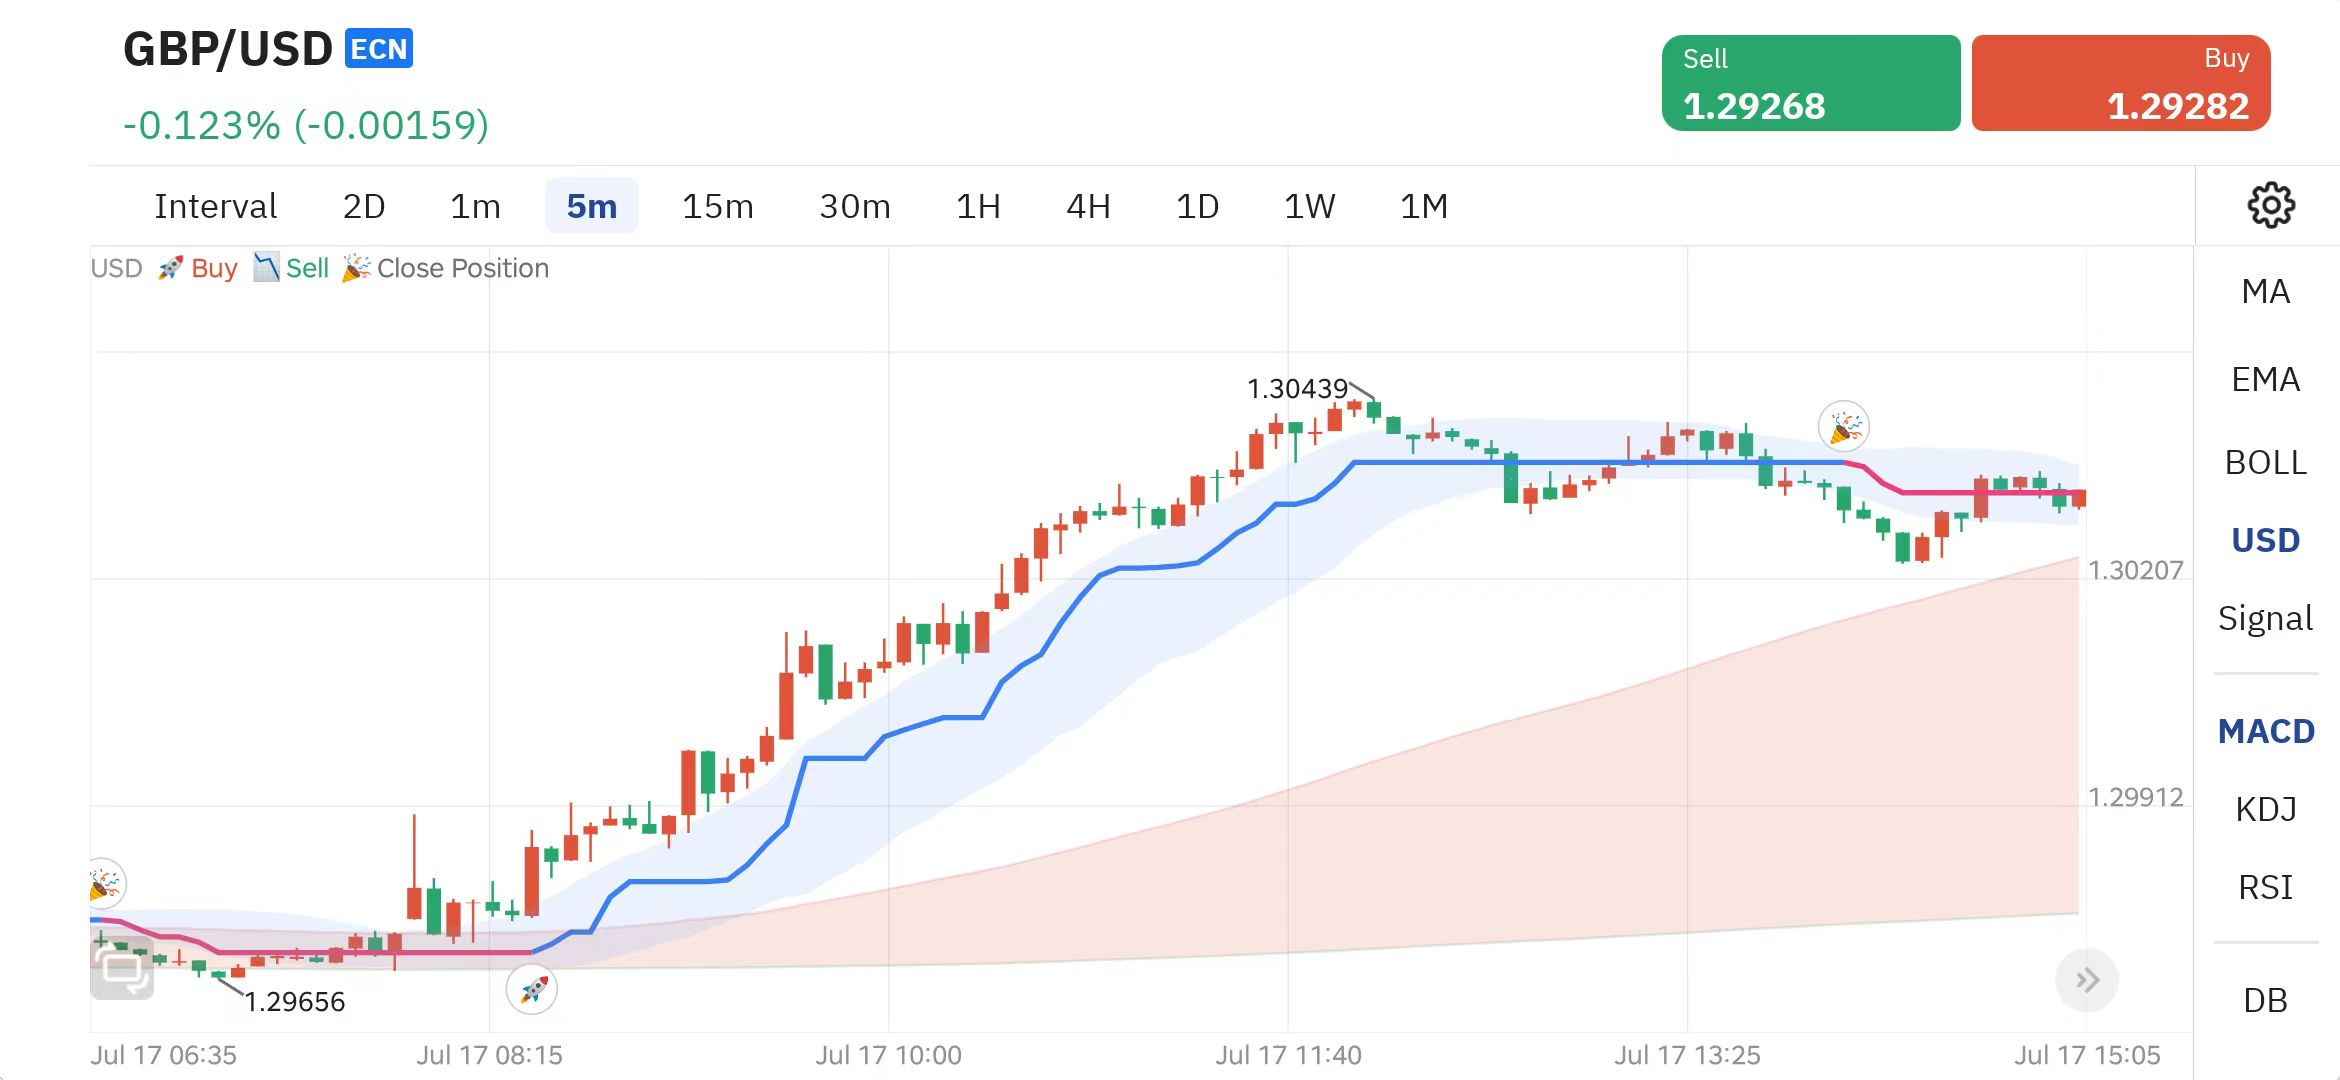
GBP/USD (5-minute chart)
Starting from 8:30 AM on July 17, 2024, the software issued a [Rocket] signal, marking the commencement of a robust [Bullish Trend].
This trend persisted until 14:05 PM on the same day, July 17, 2024, when a [Trumpet] signal emerged, signifying the conclusion of the [Bullish Trend].
Within this timeframe, the trading range was 582 points.
Intelligent pattern recognition· WTI Crude Oil
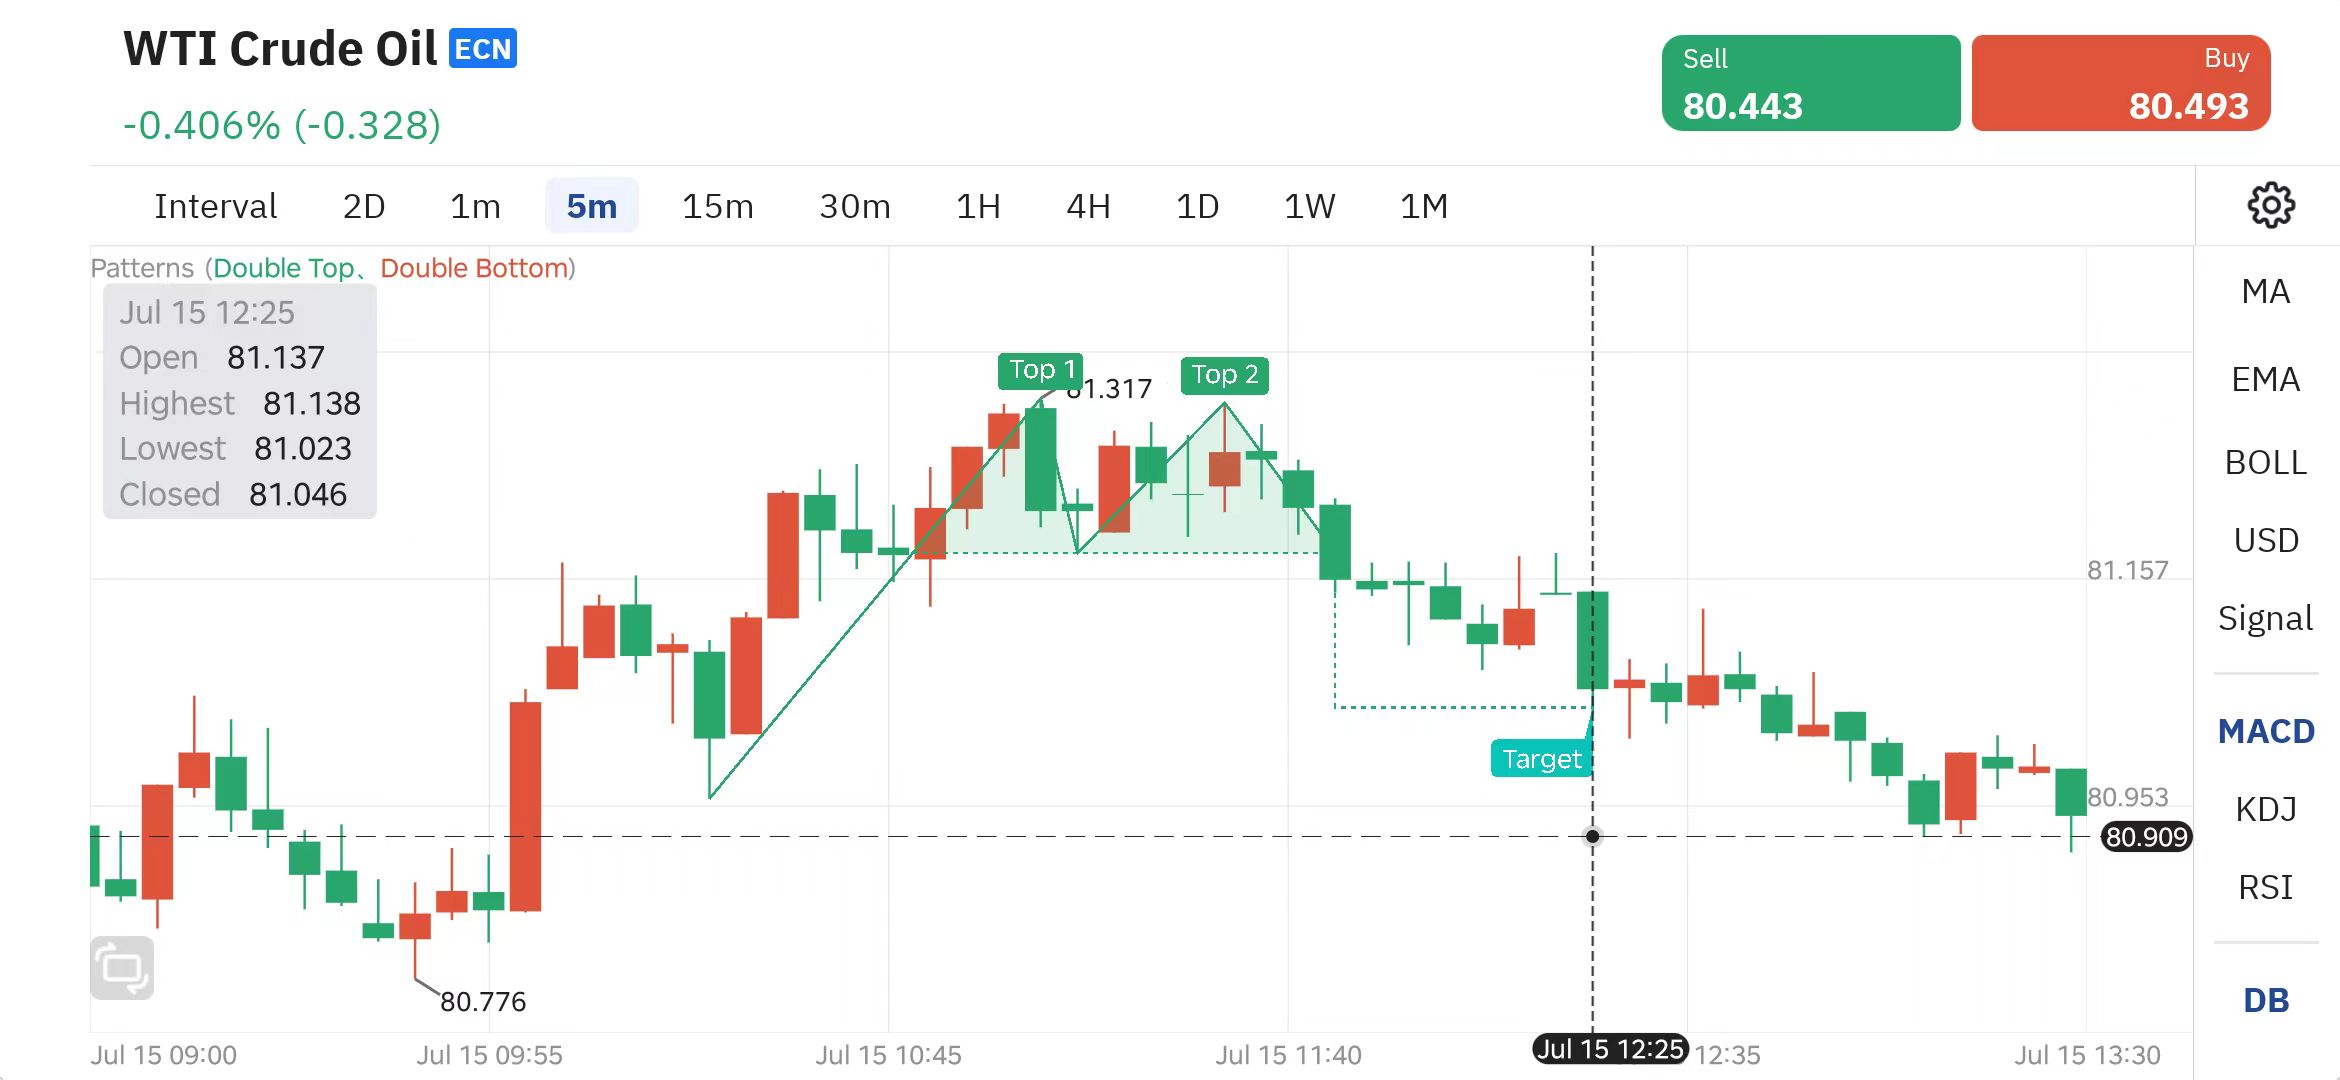
U.S. WTI Crude Oil (5-minute chart)
At 10:55 AM (July 15th), the system generated its [initial signal].
Fifteen minutes later, at 11:10 AM, we observed the formation of [the first peak]. Subsequently, within another 25 minutes by 11:35 AM, [the second peak] was established, confirming the completion of a [Double Top pattern].
Acting promptly, we initiated a [short position] at a price of 81.313.
At 1:10 PM, the system indicated that our [Target] had been reached. We [exited the position] at a price of 80.909.
· Gold
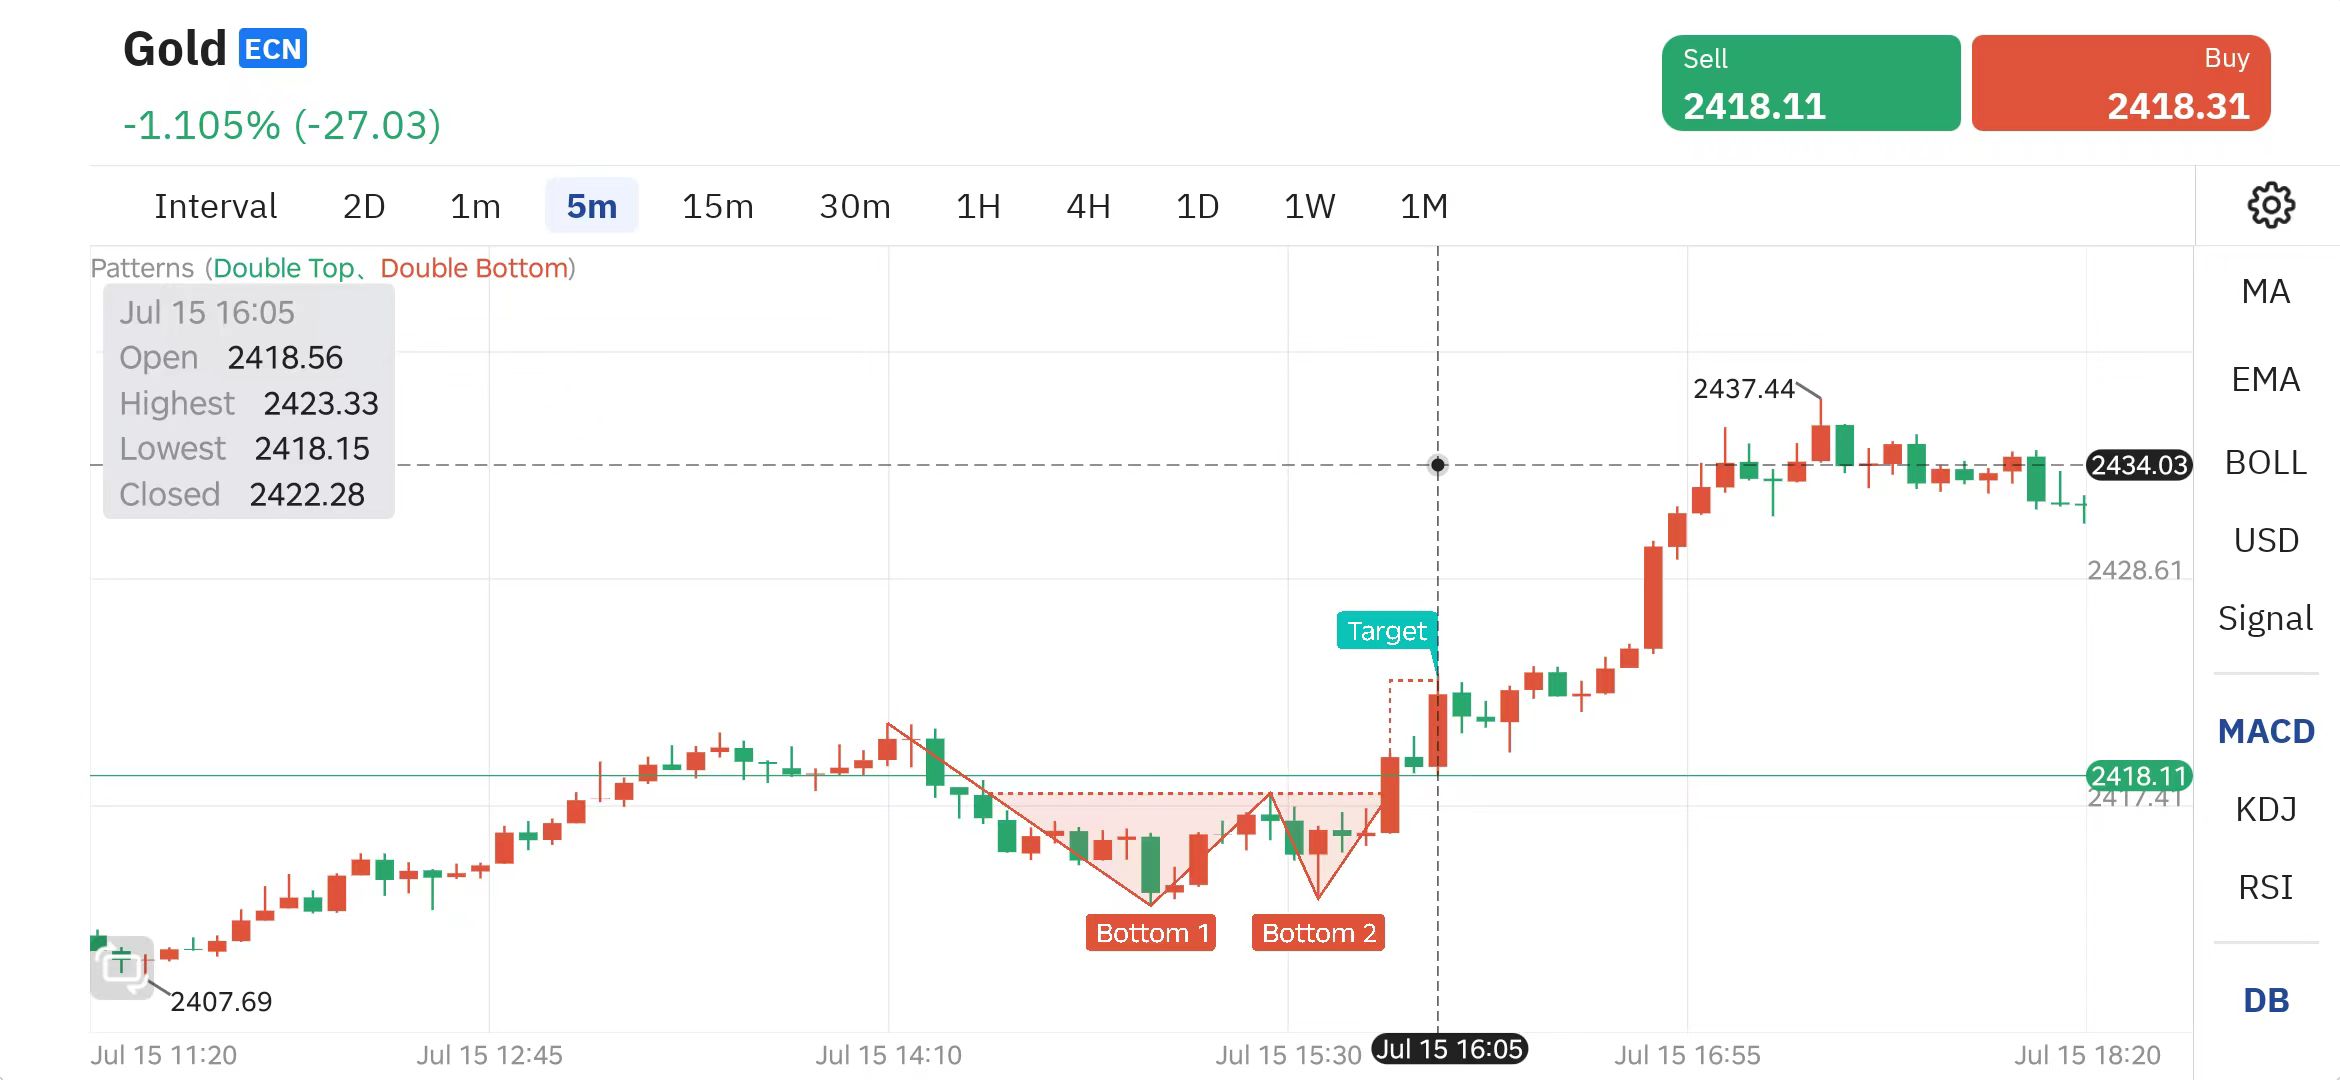
Spot Gold (5-minute chart)
At 14:20 PM on July 15th, the system issued its [initial signal].
Forty-five minutes later, at 15:05 PM, we observed the [first bottom] forming. Subsequently, thirty-five minutes after that, at 15:40 PM, the [second bottom] was established, signaling the confirmation of a [Double Top pattern].
Promptly, we established a [long position] at a price of 2412.01.
At 17:05 PM, the system indicated the [Target]. We [exited the position] at a price of 2434.03.
Weekly Trending Product Analysis
USD/JPY
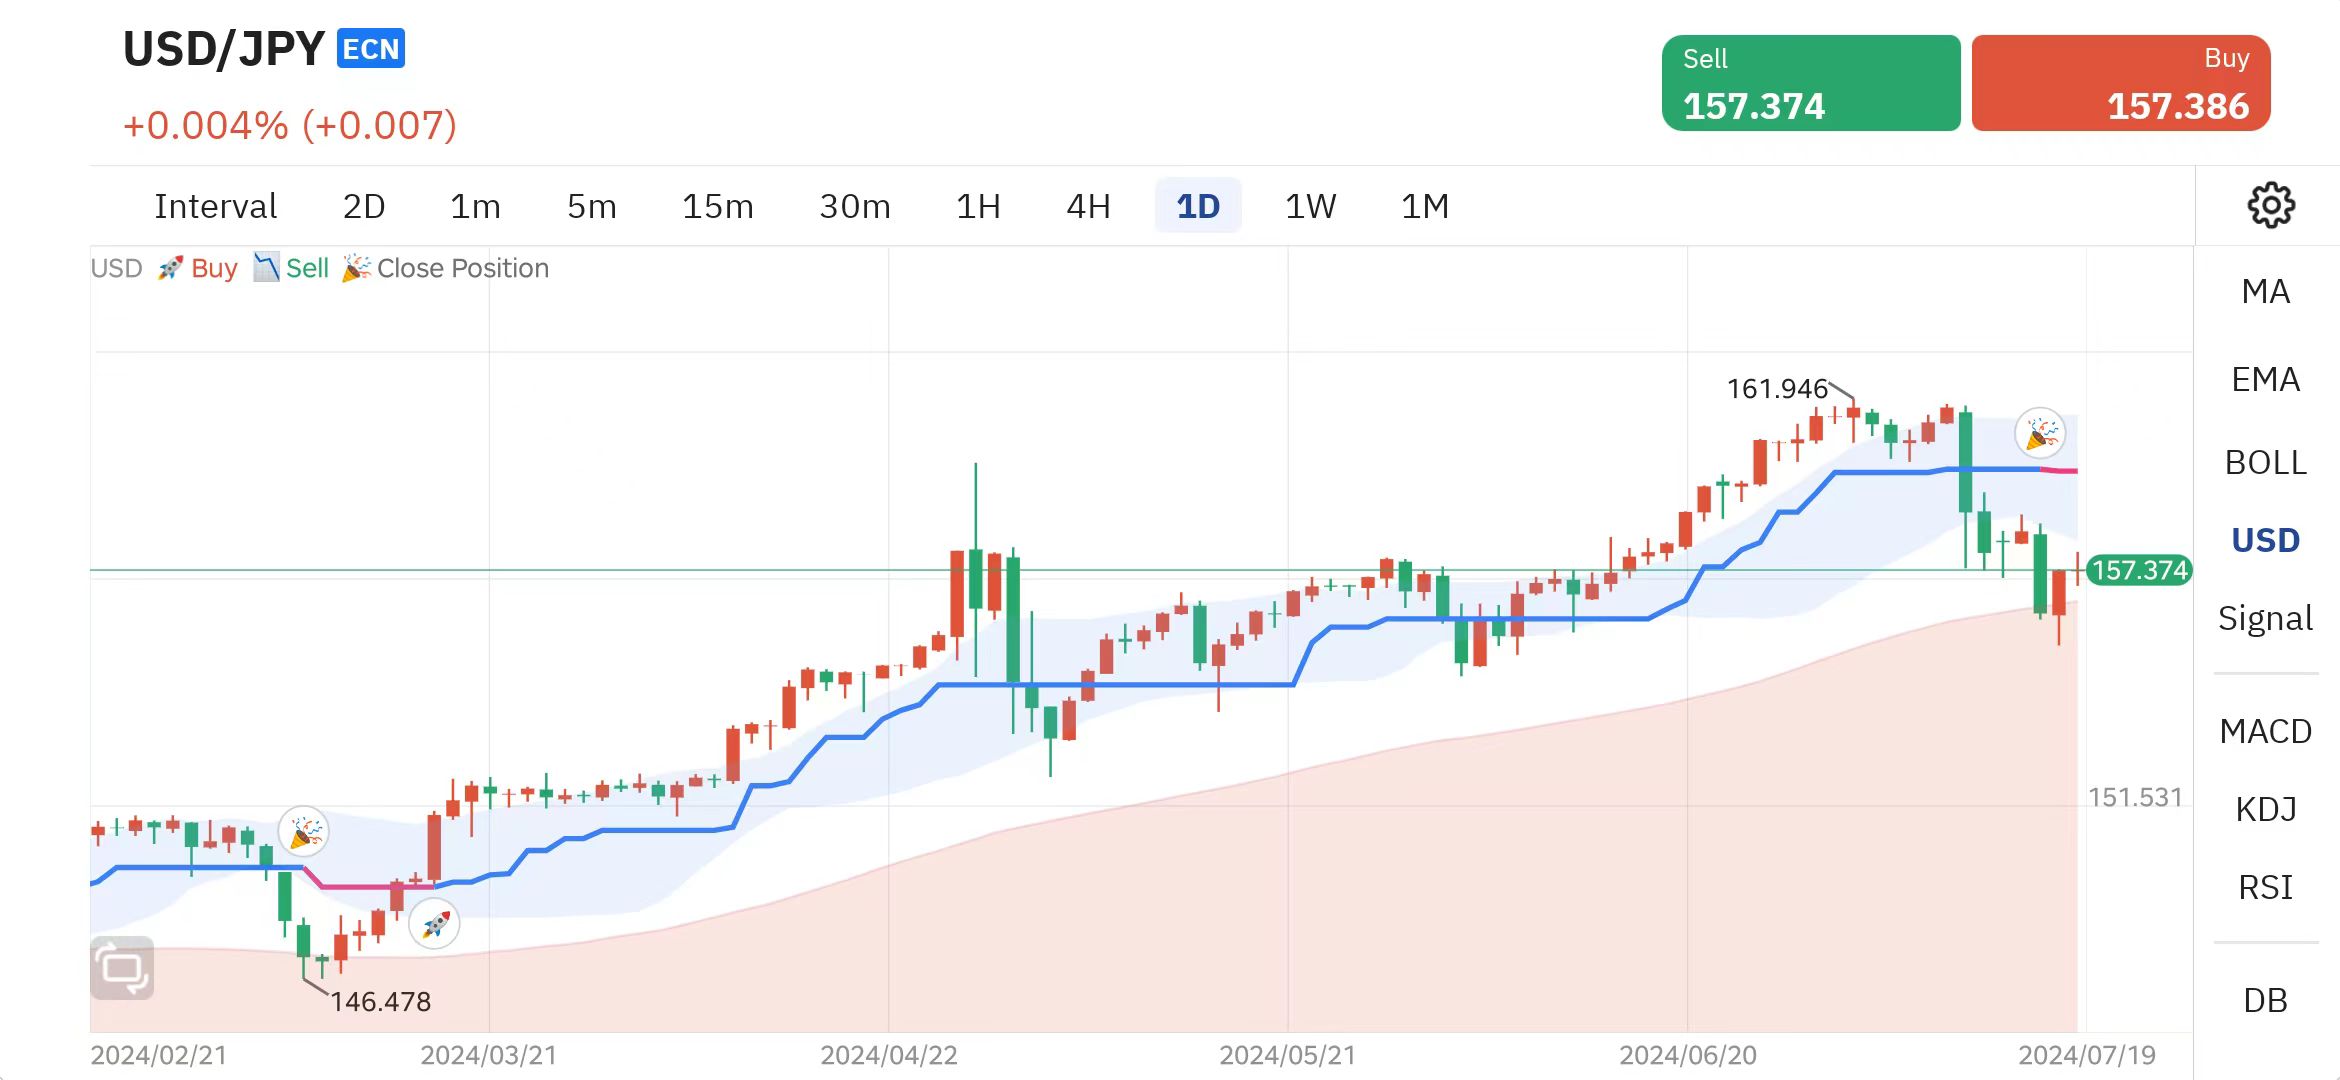
USD/JPY (daily chart)
Starting from March 19, 2024, the software issued a [Rocket] signal, heralding the commencement of a [Bullish Trend].
This trend continued all the way until July 17, 2024, which was last Wednesday, when a [Trumpet] signal emerged, signaling the end of the [Bullish Trend].
Within this time frame, the operating range was [8389 points].
From current analysis, a [new entry signal] for this week's trend could be issued at any time; please stay locked onto the trend signal source.
Weekly Trending Product Analysis
Bitcoin
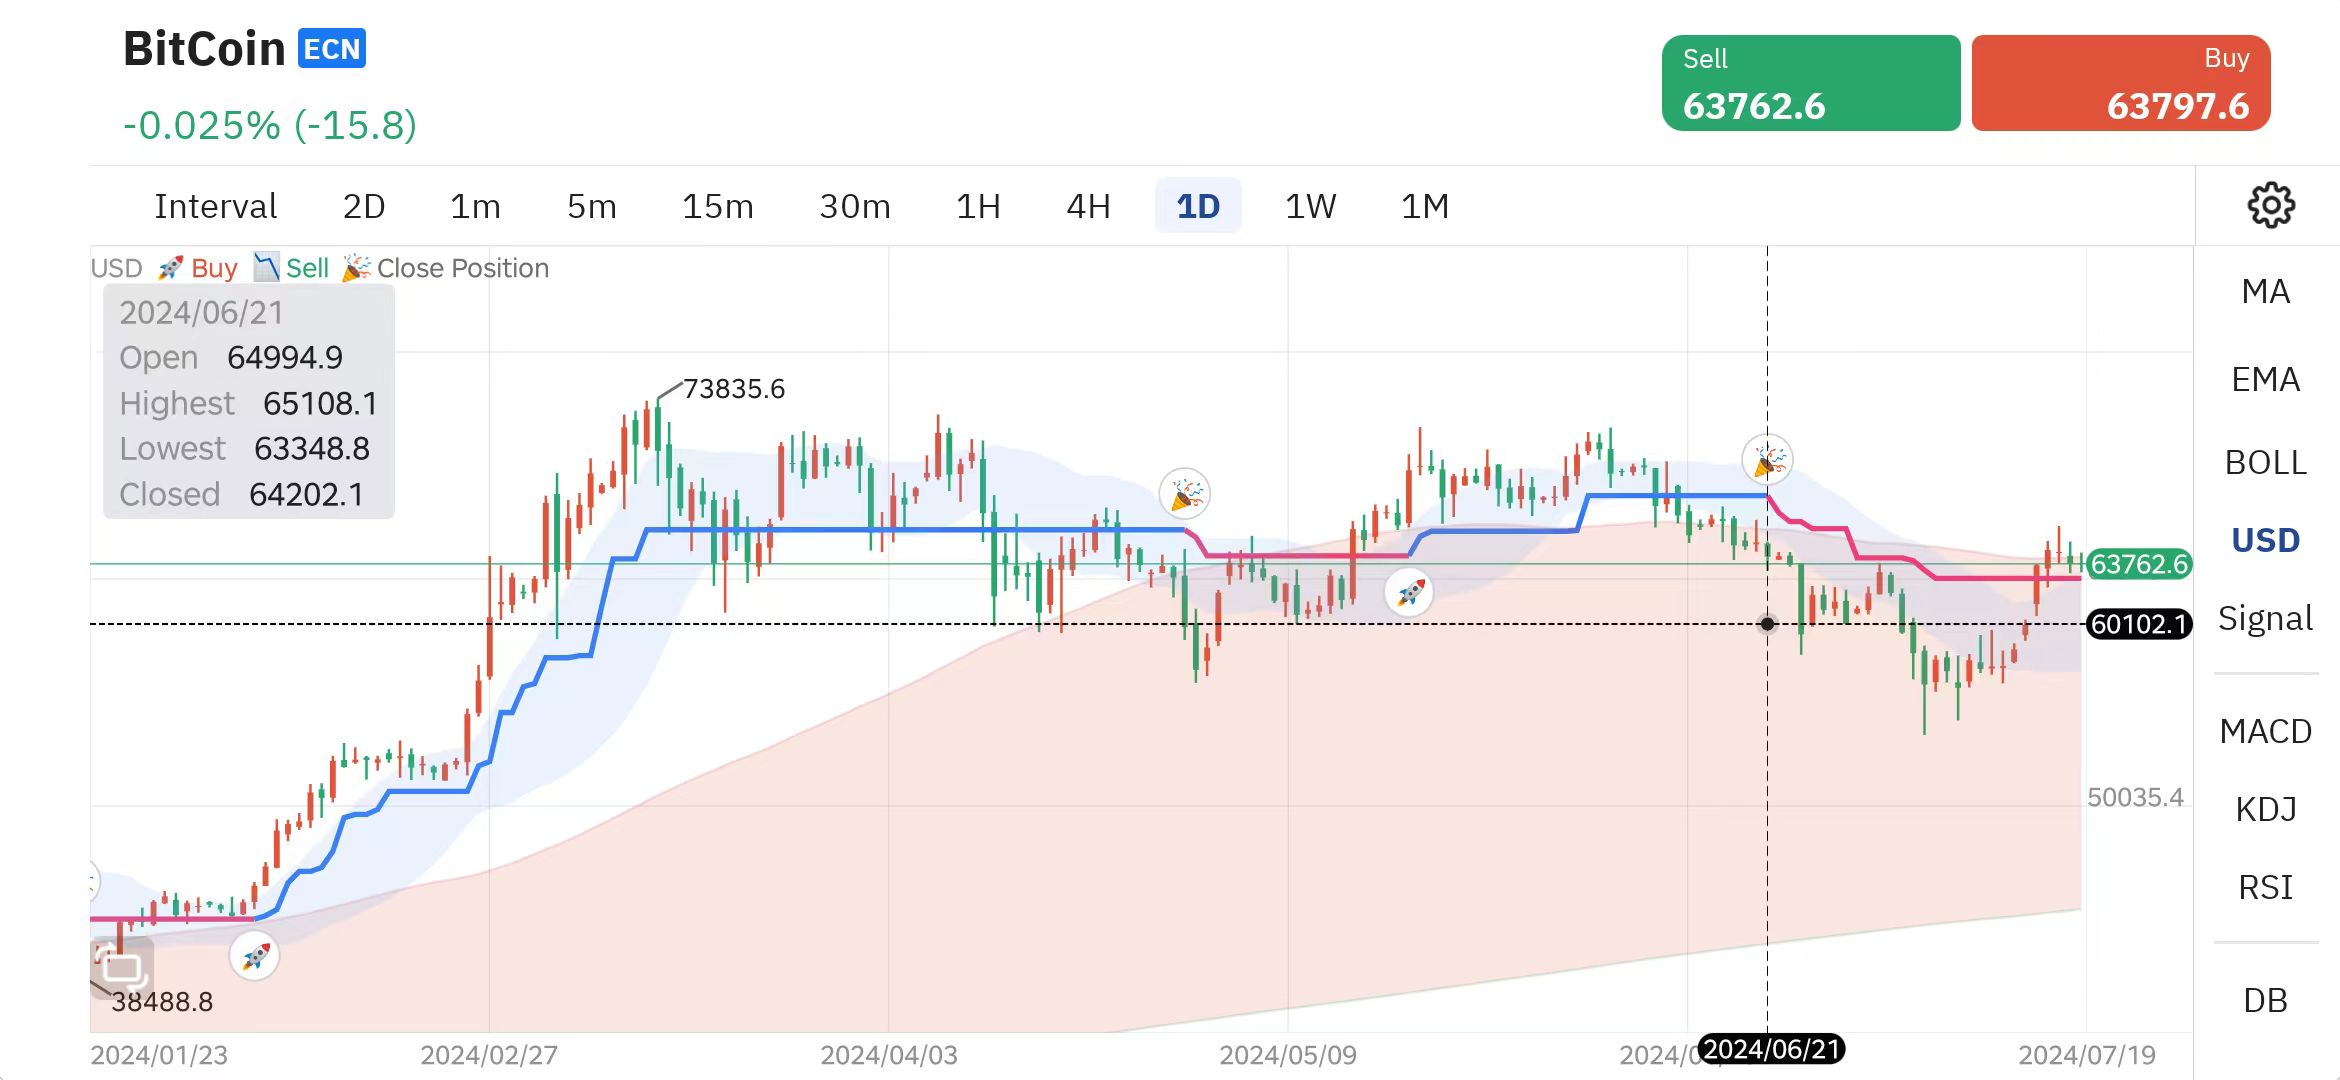
BTC(daily chart)
Since June 21, 2024, the Bitcoin market has shown a continuous [concussive downward] trend, hitting a [historical low] of $53,354.
Although there is no clear [new trend signal] yet, based on Bitcoin’s current [rebound trend], it is expected that [new trend signal] will be given randomly this week.
Investors can lock Bitcoin as a [new entry signal] and be ready to [open a position] at any time.
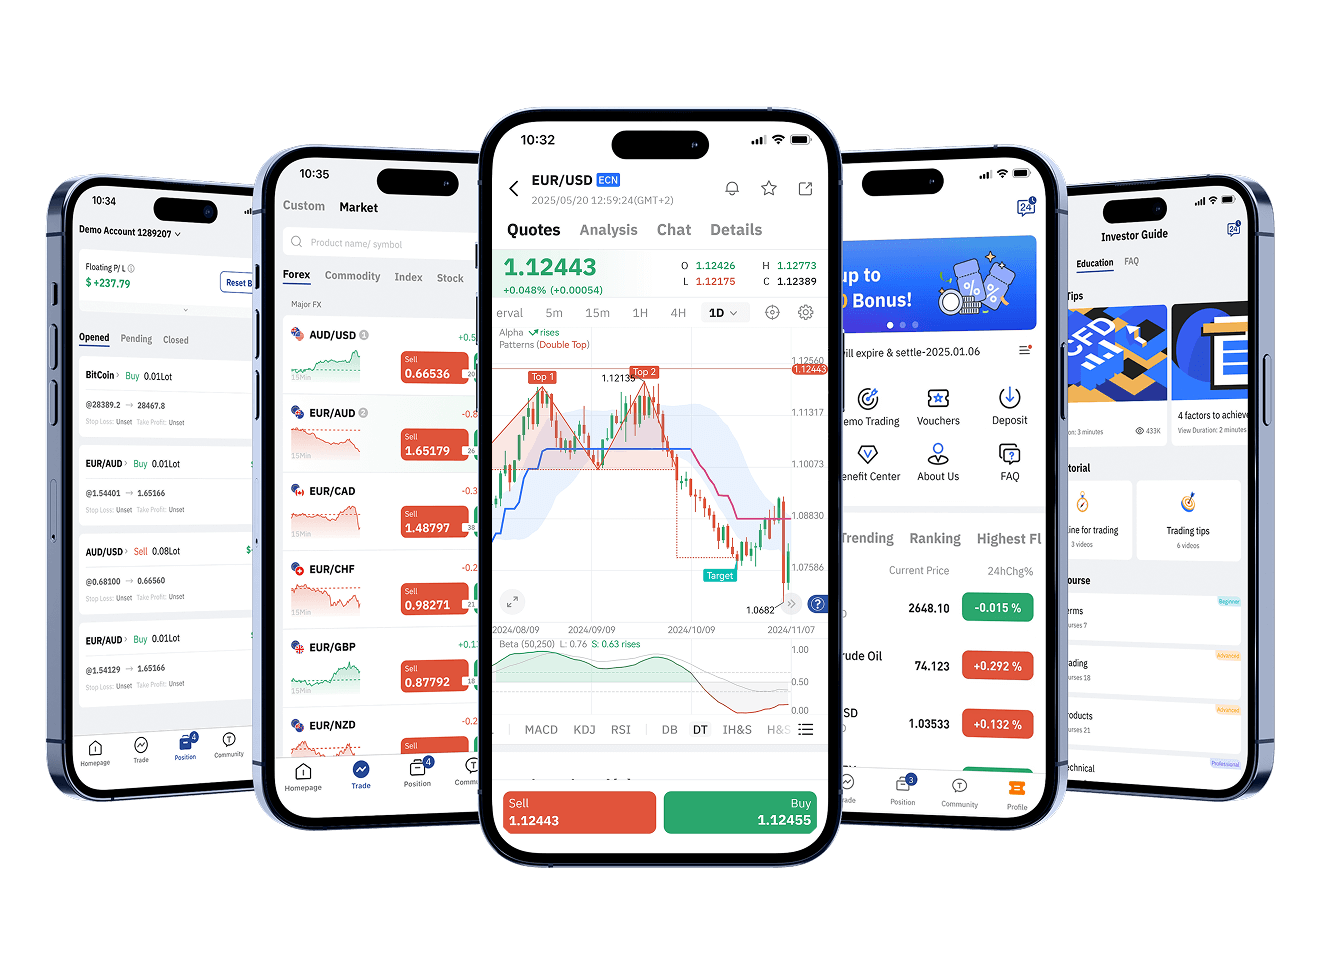
Download TOPONE Markets
Download TOPONE Markets
Get the most profitable trading signals first, 1 million traders have downloaded it, and the average daily profit opportunities exceed 200!