English


 Performance Overview
 After 5 hours of fierce battle, a double bottom in gold has forged a 1.73 times profit!
- WTI crude oil forms a bearish pennant pattern at high levels, gaining 146% in 19 hours!
Best Performance of Last Week
AI backtracks classic patterns to analyze high-value signal features.
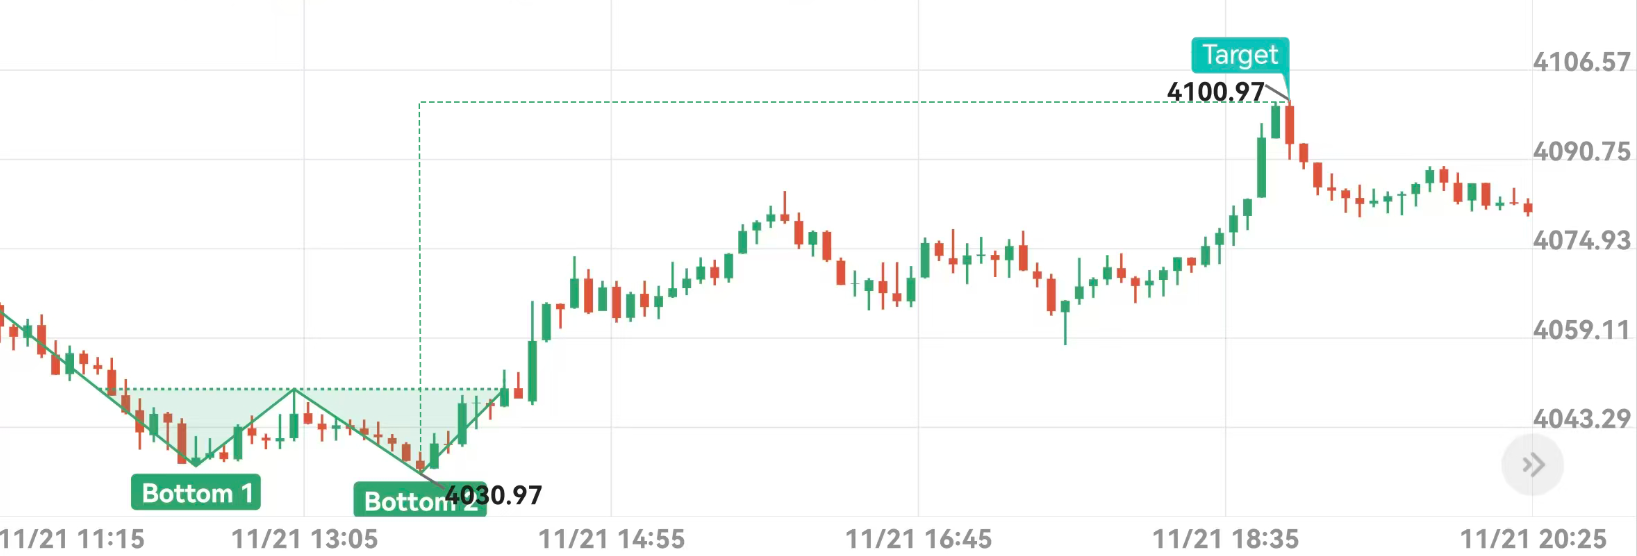
Signal Entry
@4030.97Take Profit
4100.97Profitability 
+173.66%Signal Commentary
At 14:00 on November 25, 2021, the spot gold closing price formed a double bottom, indicating a second bottoming out. The confirmation of the double bottom suggests the arrival of an upward trend. Five hours later, the double bottom target was reached, with a profit target of 4100.97. This round of operations recorded a profit of +173.66%, which can be regarded as one of the best performance signals of the week.
 Bearish Pennant
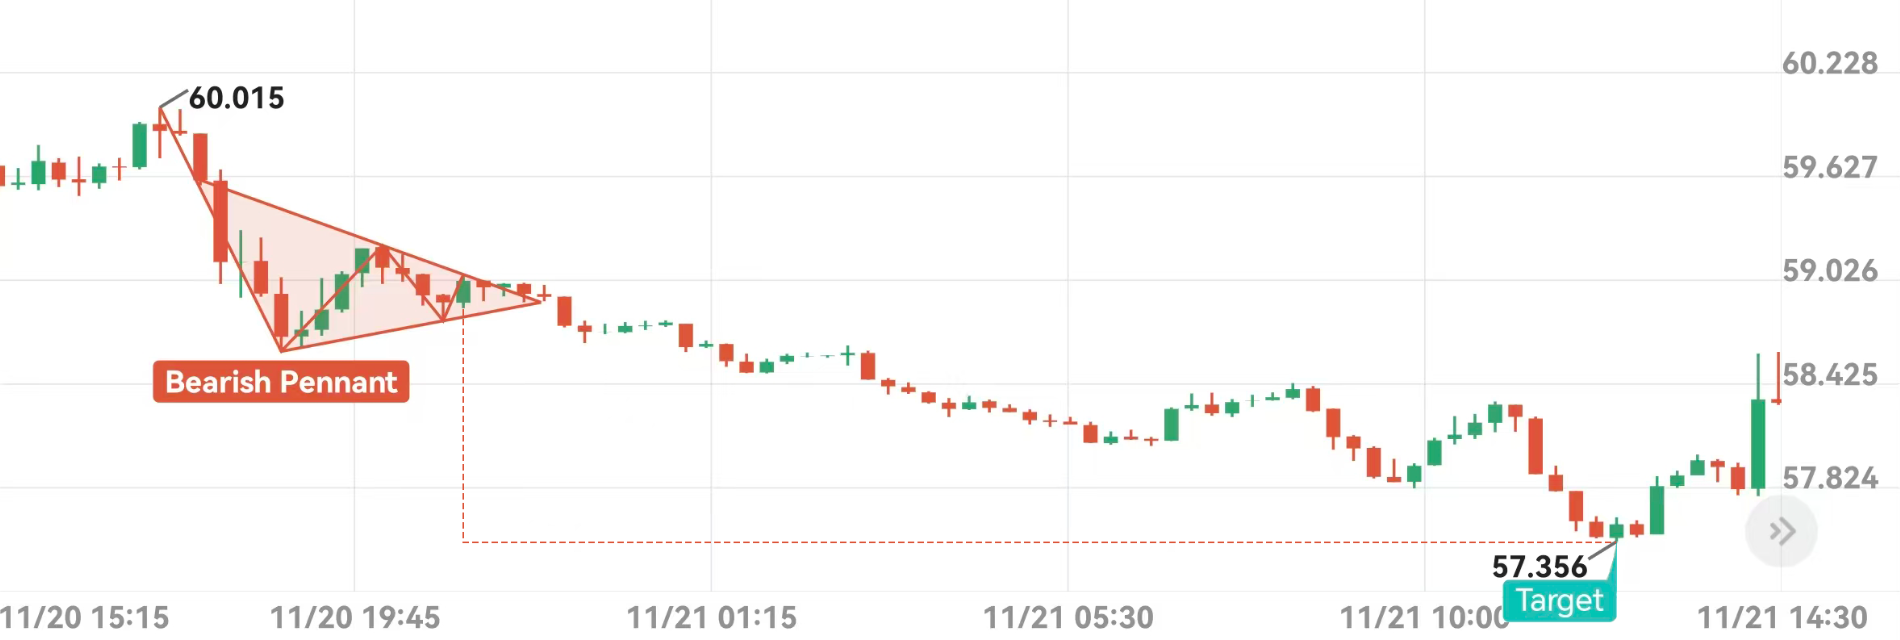
Signal Entry
@60.015Take Profit
57.356Profitability
+146.21%Signal Commentary
At 17:30 on November 25, 2020, the closing price of WTI crude oil formed a bearish pennant pattern, which doubled in price. The confirmation of the bearish pennant pattern indicates the arrival of a downtrend. Nineteen hours later, the target of the bearish pennant pattern was reached, with a profit target of 57.356. This round of trading recorded a profit of +146.21%, making it one of the best-performing signals of the week.
 Bullish Flag
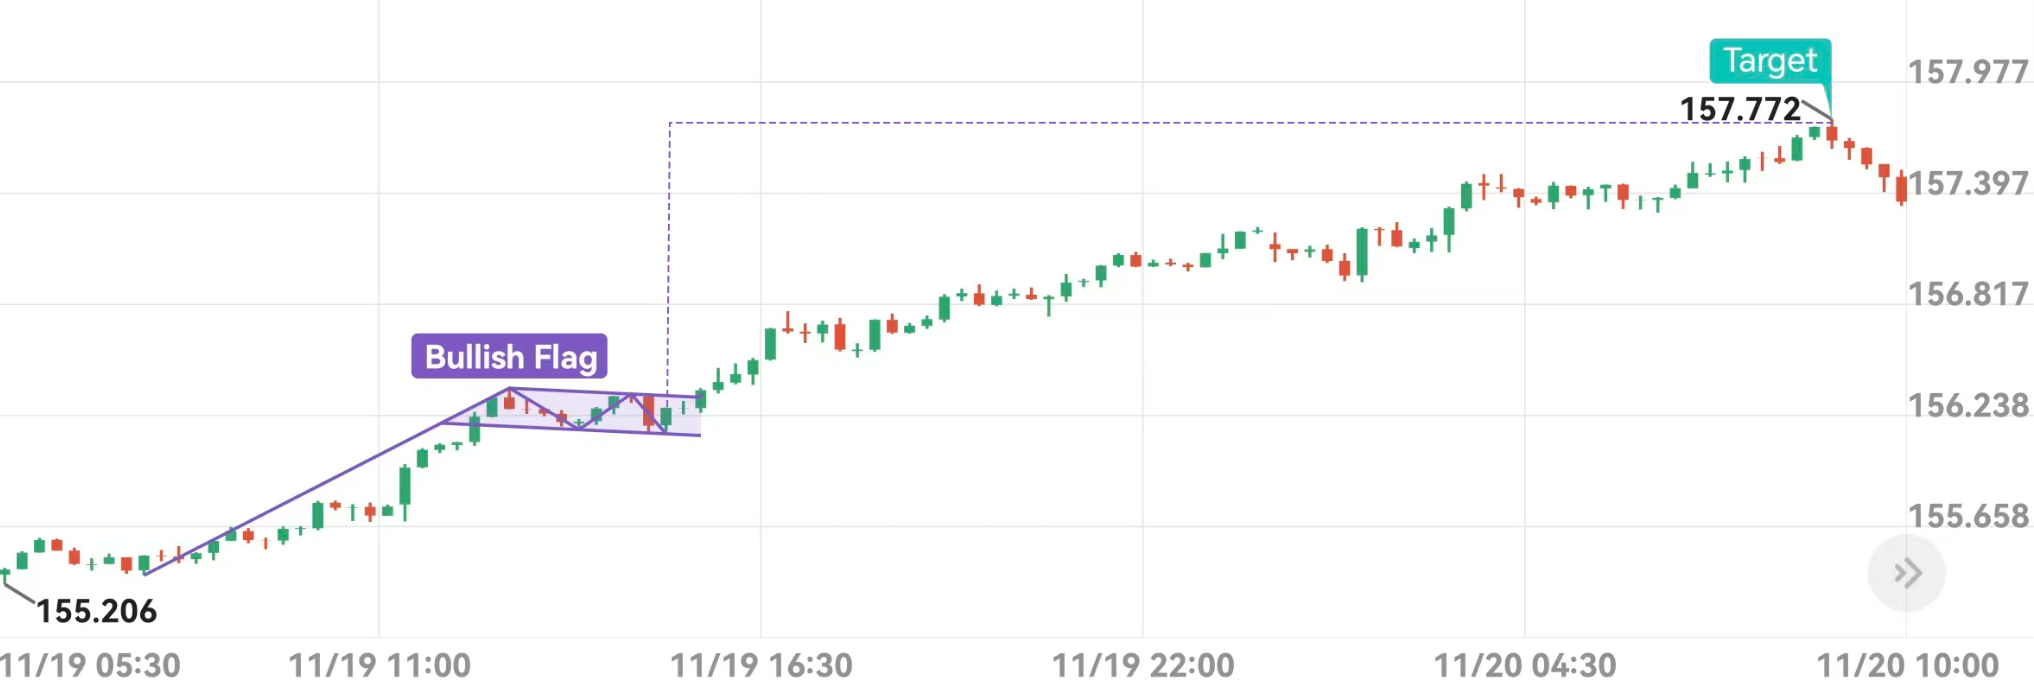
Signal Entry
@156.036Take Profit
157.772Profitability
+58.68%Signal Commentary
At 15:30 on November 25, 2019, the USD/JPY closing price formed a bullish flag pattern, indicating a double bottom. The confirmation of the bullish flag pattern suggests the arrival of an upward trend. 17.5 hours later, the target of the bullish flag pattern was reached, with a profit target of 157.772. This round of trading recorded a profit of +58.68%, making it one of the best-performing signals of the week.
Hot Opportunities This Week
Track the evolution of classic patterns in real time and identify potential trading opportunities.
 Bullish Pennant
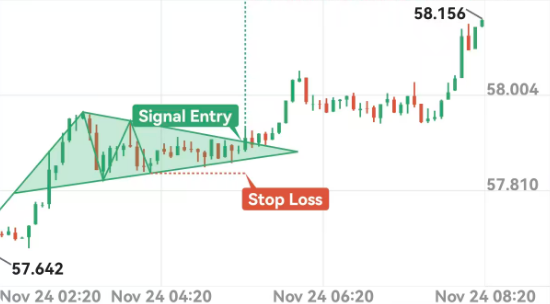
Signal Entry
@57.867Take Profit
58.202Stop Loss
57.820Opportunity Analysis
November 25, 2024, 5:30 AM: US crude oil - A bullish pennant pattern has been confirmed on the 5-minute chart. The closing price broke through the upper trendline of the bullish pennant pattern, indicating that the correction is over and the price will continue to rise. Bullish, take profit at 58.202, stop loss at 57.820.
Review Past Analyses
*Disclaimer
TOPONE Markets' AI pattern recognition provides only pattern-based analysis and does not constitute investment advice or a guarantee of returns. It is recommended to unlock premium access to view the latest pattern signals, respond to market changes, and manage risk appropriately.
Download TOPONE Markets
Download TOPONE Markets
Get the most profitable trading signals first, 1 million traders have downloaded it, and the average daily profit opportunities exceed 200!