English


 Performance Overview
 Major opportunity emerges with double bottom pattern, one signal yields 333.89% profit!
- 13.5 hours, USD/JPY surged 64.63%!
Best Performance of Last Week
AI backtracks classic patterns to analyze high-value signal features.
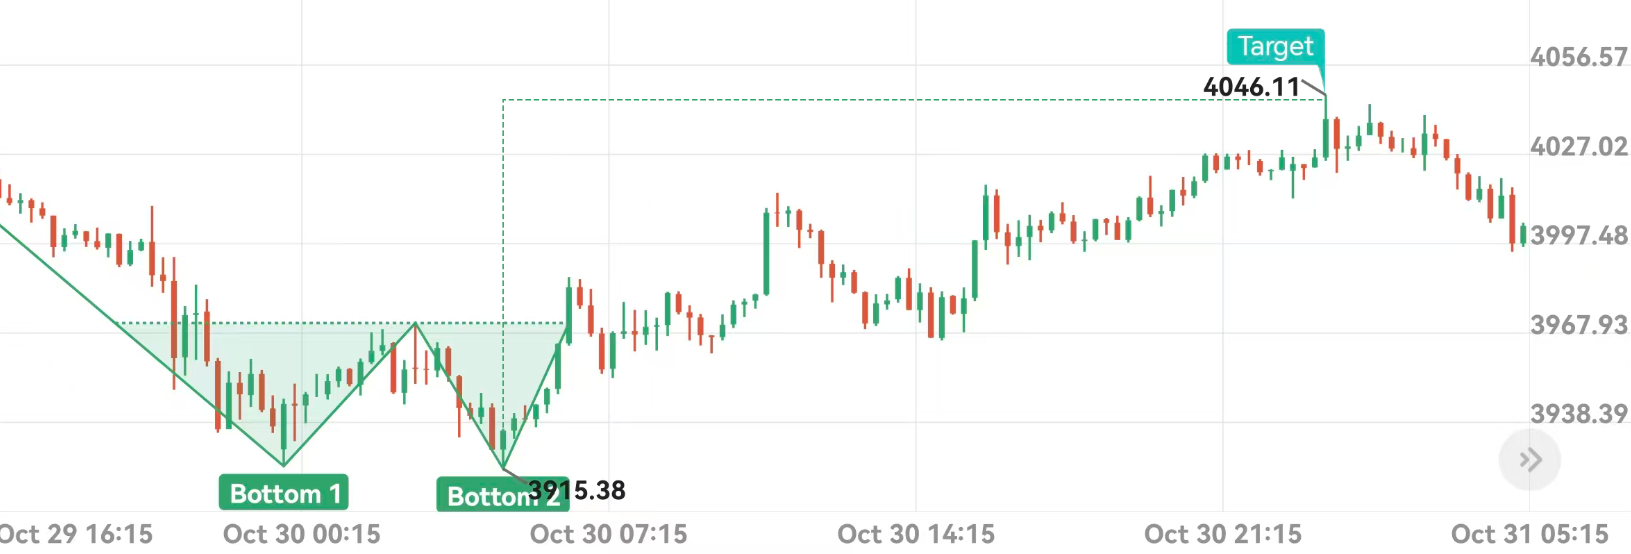
Signal Entry
@3915.38Take Profit
4046.11Profitability 
+333.89%Signal Commentary
At 5:00 AM on October 25, 2023, the spot gold closing price formed a double bottom, indicating a second bottoming out. The confirmation of the double bottom suggests the arrival of an upward trend. 19.5 hours later, the double bottom target was reached, with a profit target of 4046.11. This round of operation recorded a profit of +333.89%, which can be regarded as one of the best performance signals of the week.
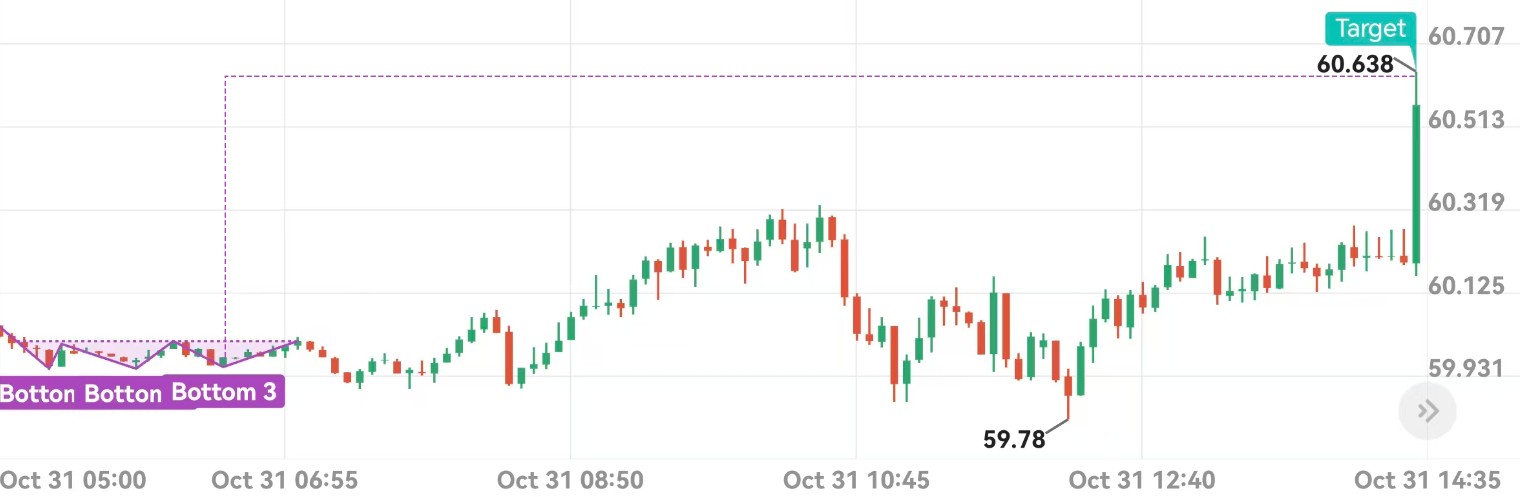
Signal Entry
@59.909Take Profit
60.638Profitability
+40.16%Signal Commentary
On October 31, 25th at 6:30 AM, WTI crude oil closed with a head and shoulders bottom pattern formed after three attempts to break below. The confirmation of the head and shoulders bottom pattern indicates the arrival of an upward trend. Six hours later, the target of the head and shoulders bottom pattern was reached, with a profit target of 60.638. This round of trading recorded a profit of +40.16%, making it one of the best-performing signals of the week.
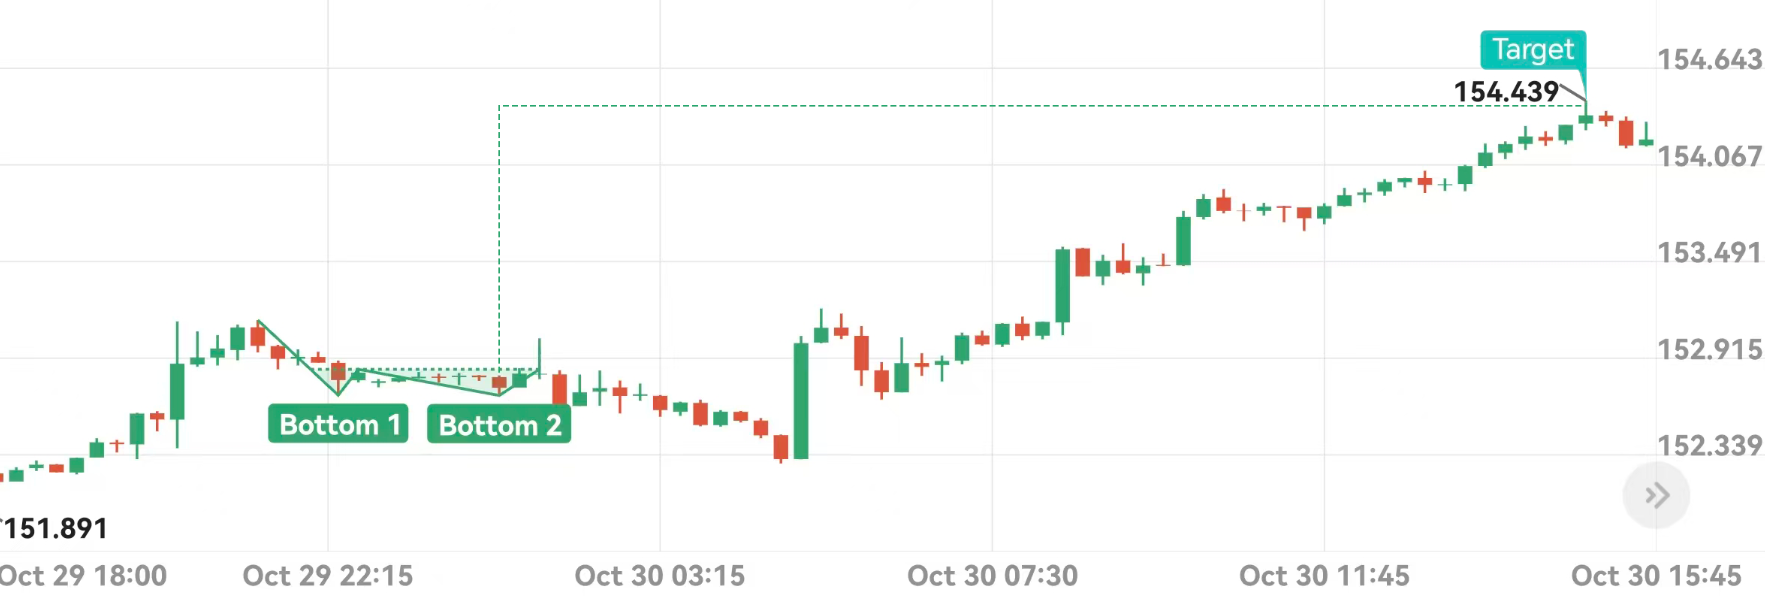
Signal Entry
@152.581Take Profit
154.493Profitability
+64.63%Signal Commentary
At 1:30 AM on October 25, 2023, the USD/JPY closing price formed a double bottom, indicating a potential upward trend. 13.5 hours later, the double bottom target was reached, with a profit target of 154.493. This round of trading yielded a profit of +64.63%, making it one of the best-performing signals of the week.
Hot Opportunities This Week
Track the evolution of classic patterns in real time and identify potential trading opportunities.
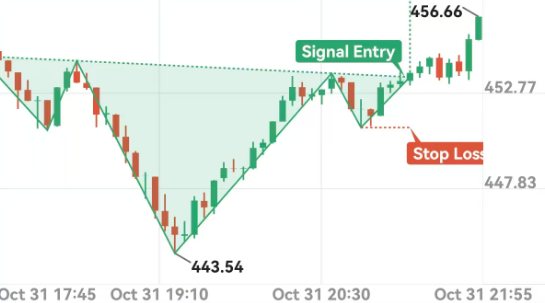
Signal Entry
@452.84Take Profit
463.29Stop Loss
450.51Opportunity Analysis
At 21:30 on October 31, 25th, the closing price broke through the neckline, confirming the head and shoulders bottom pattern and indicating that the market is about to turn from a downtrend to an uptrend. Bullish, take profit at 463.29, stop loss at 450.51.
Review Past Analyses
*Disclaimer
TOPONE Markets' AI pattern recognition provides only pattern-based analysis and does not constitute investment advice or a guarantee of returns. It is recommended to unlock premium access to view the latest pattern signals, respond to market changes, and manage risk appropriately.
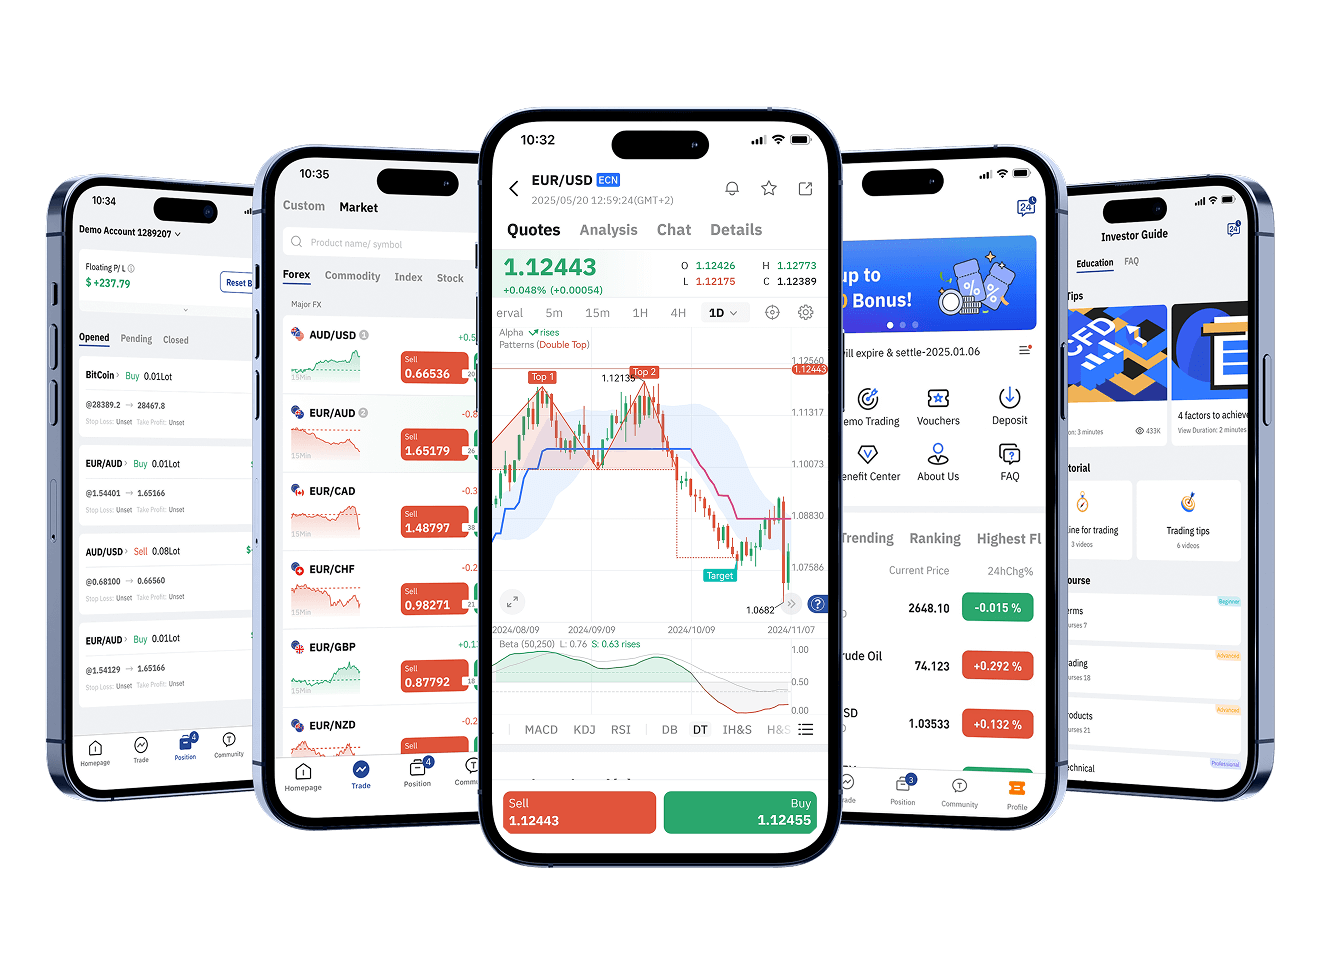
Download TOPONE Markets
Download TOPONE Markets
Get the most profitable trading signals first, 1 million traders have downloaded it, and the average daily profit opportunities exceed 200!