English


Last Week's Performance Analysis
- 【Head and Shoulders Pattern】Earned 17.5 times in 7 hours!
- Can the 【Head and Shoulders Bottom Pattern】 replicate 20x profits?!
 AI Form
· Dow Jones Index
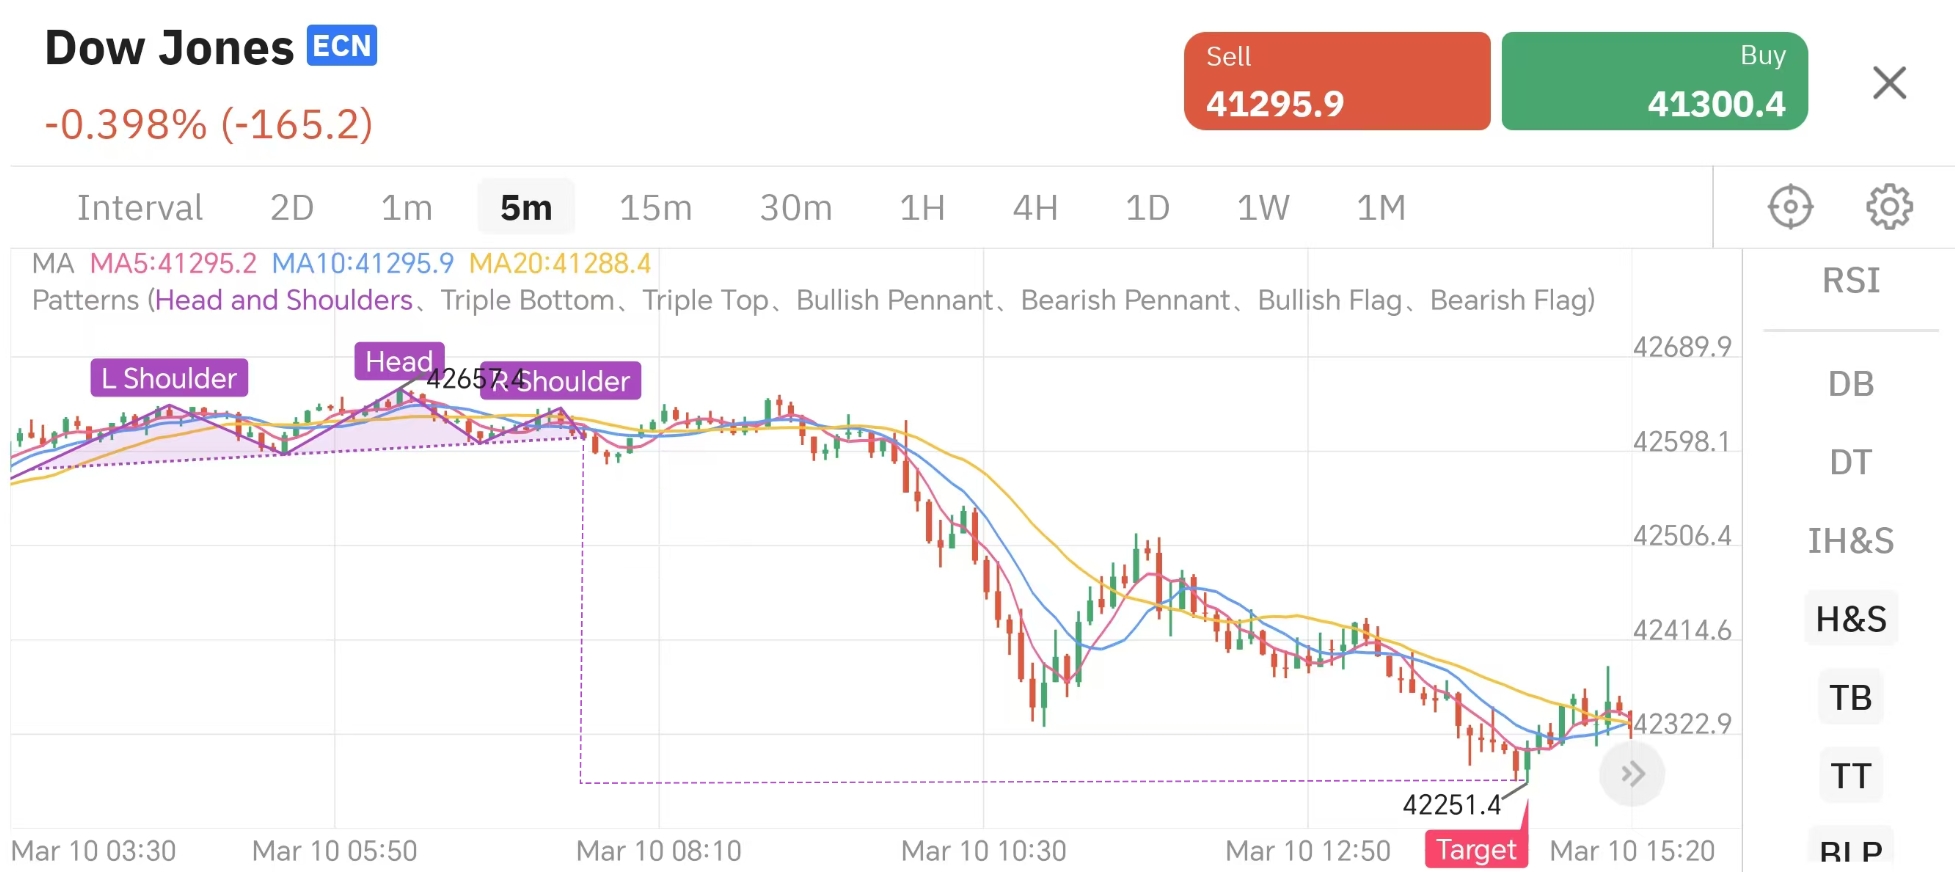
Dow Jones Index (5-minute chart)
Last Monday, March 10th, at 3:30 AM, the Dow Jones Index presented a shorting opportunity with a 【head and shoulders】 pattern.
The 【first shoulder】 was formed at 4:35 AM that morning, and the 【second shoulder】 was formed at 7:40 AM. The formation of the 【second shoulder】 simultaneously marked the establishment of the 【head and shoulders top】 pattern.
If we chose to 【short】 at the 【second shoulder】 position at a price of 42600.8.
This downward trend could be held until 14:30 that afternoon, when the system signaled 【Target】 to close the position at a price of 42251.4.
From opening to closing the position, the entire trend lasted 7 hours. Through the AI pattern indicator's 【head and shoulders top】 pattern, the profit space brought by this trend was 349.4 points.
Calculating with the Dow Jones Index contract size of 5 and a margin of $100, the profit from signal issuance to conclusion was:
349.4*5=$1747
The profit rate was:
1747/100*100%=1747%
A profit of 1747% in 7 hours, with the principal multiplied by 17.5 times.
Weekly Trending Product Analysis
Unknown
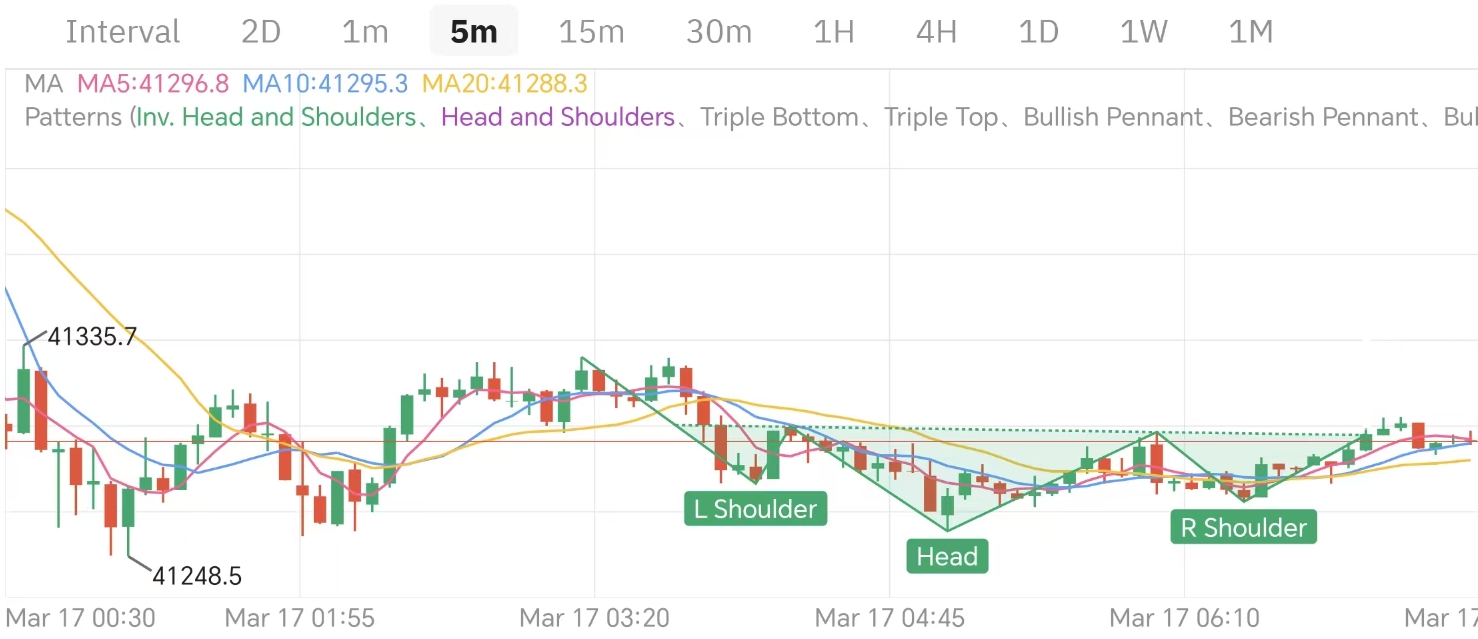
A product (5-minute chart)
Recently, a certain product in the market has shown a classic 【head and shoulders bottom】 technical pattern on the 5-minute K-line chart. This pattern is similar to the 【head and shoulders top】 pattern we captured last week, with the difference being that one is a shorting opportunity and the other is a long opportunity. This time's 【head and shoulders bottom】 pattern indicates a potential long opportunity. Currently, the product has not yet formed a breakout action, and technical indicators suggest that a strong upward trend may occur within the next 6-7 hours. Referring to the performance of the Dow Jones Index's 【head and shoulders top】 pattern, the potential profit margin this time could reach 15-20 times.
Characteristics of Trading Opportunities
1、Short Time Window:Based on the technical pattern of the 5-minute K-line chart, the trading opportunity is extremely short-lived, with the entire trading cycle expected to end within 10 hours.
2、High Profit Potential:
Download TOPONE Markets
Download TOPONE Markets
Get the most profitable trading signals first, 1 million traders have downloaded it, and the average daily profit opportunities exceed 200!