Melayu


Analisis Prestasi Minggu Lalu
- Pertempuran emas 6 jam: menggandakan keuntungan anda bukan mimpi!
- Rahsia untuk membuat wang cepat dengan minyak mentah: 57% keuntungan dalam 55 minit!
- Nasdaq double top pattern: a precursor to a big drop that investors need to be wary of!
 Quantitative indicators - USD (super trend)
· Gold
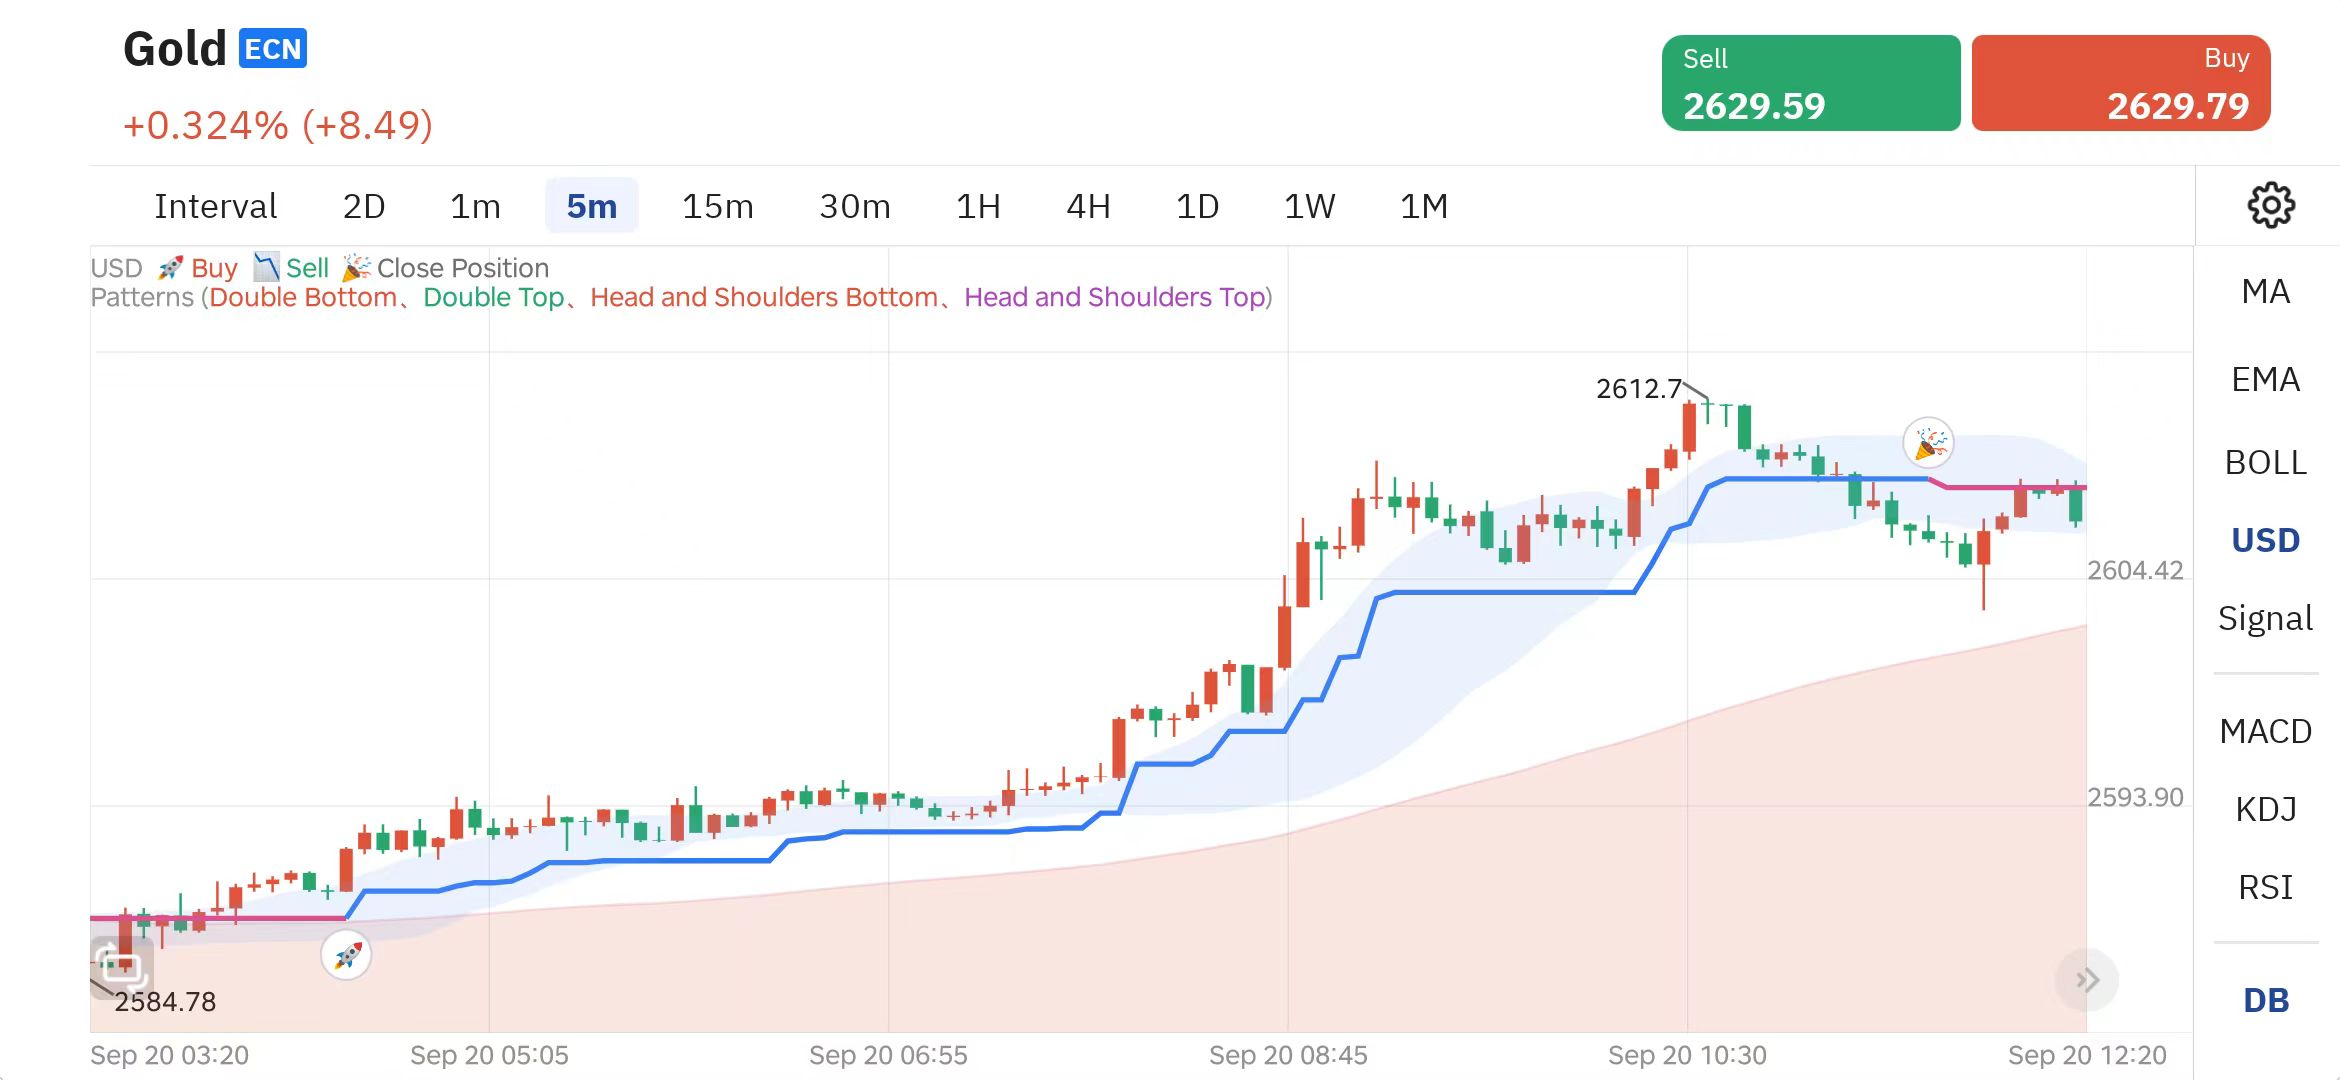
Gold (5-minute chart)
At 4:25 am on September 20, spot gold issued a 🚀 signal at 2588.59, which indicated that a wave of [bullish trend] was about to form. After that, the price rose all the way. The upward trend continued until 10:50 am that day, at 2612.42, when the 🎉 signal appeared and ended.
The whole process lasted 6 hours and 30 minutes. The super trend indicator [USD] brought us this wave of operation points with a span of 2383 points. The profit margin reached 100.92%, with a profit of 1 times.
Pengecaman corak pintar· WTI crude oil
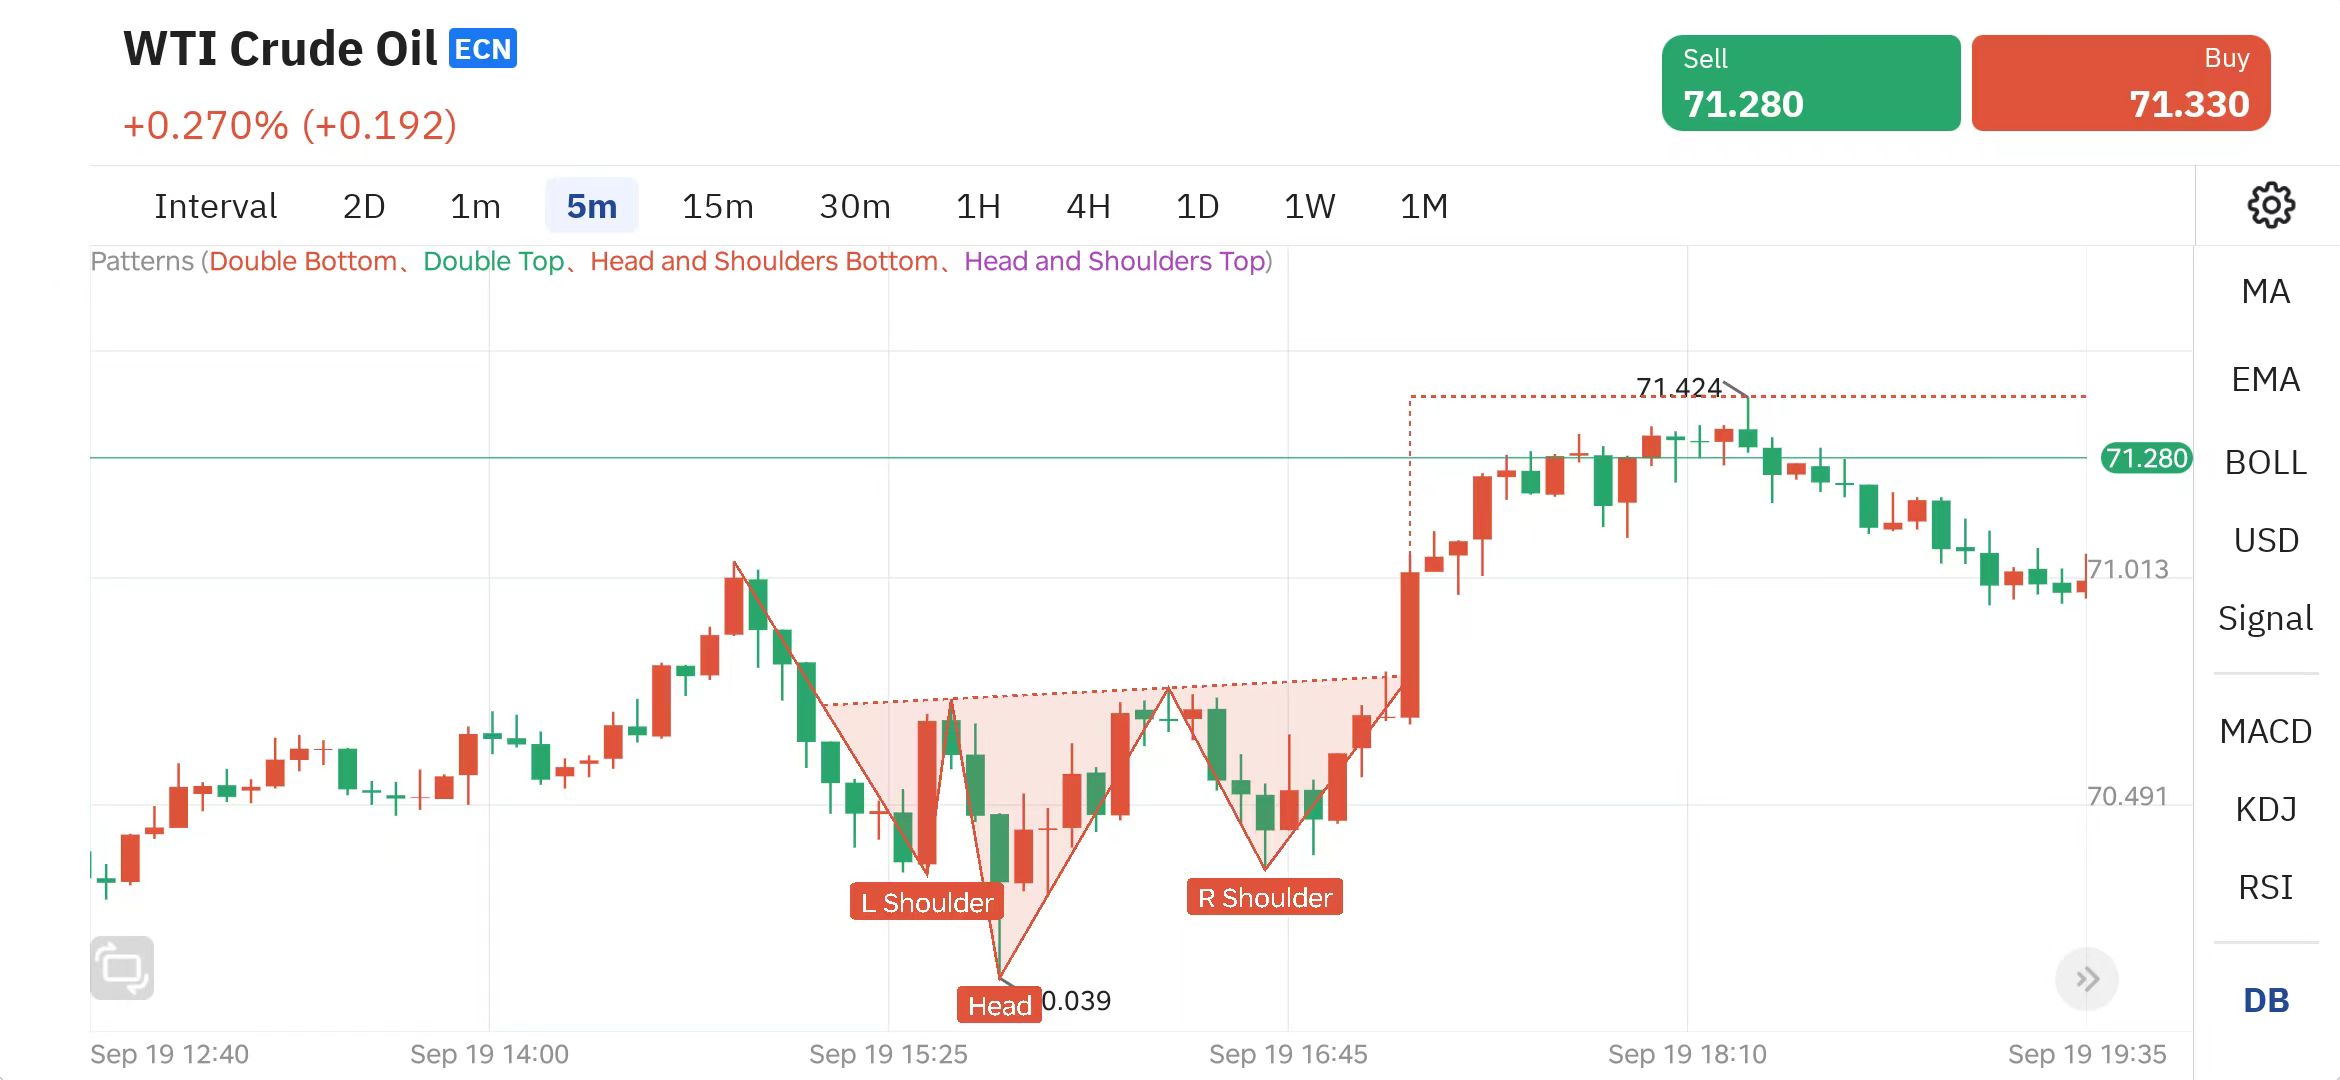
US WTI crude oil (5-minute chart)
At 14:55 on the afternoon of September 19, WTI crude oil had a wave of [Head and Shoulders Bottom] opportunities.
[1st shoulder] was formed at 15:35, [Head] was formed at 15:50. [2nd shoulder] was formed at 16:45. After the formation of [2nd shoulder], it marked the establishment of [Head and Shoulders Bottom Pattern]. If we choose to [go long] at the [2nd shoulder] position at a price of 70.297.
We can hold this wave of market until 18:25 that afternoon, and the system prompts [Target] to close the position again, and the closing price is 71.424.
From opening to closing, the whole wave of market took only 55 minutes. The profit margin brought by the [Head and Shoulders Bottom] signal is 1127 points, and the profit rate has reached 56.35%.
Analisis Produk Sohor Kini Mingguan
Nasdaq 100
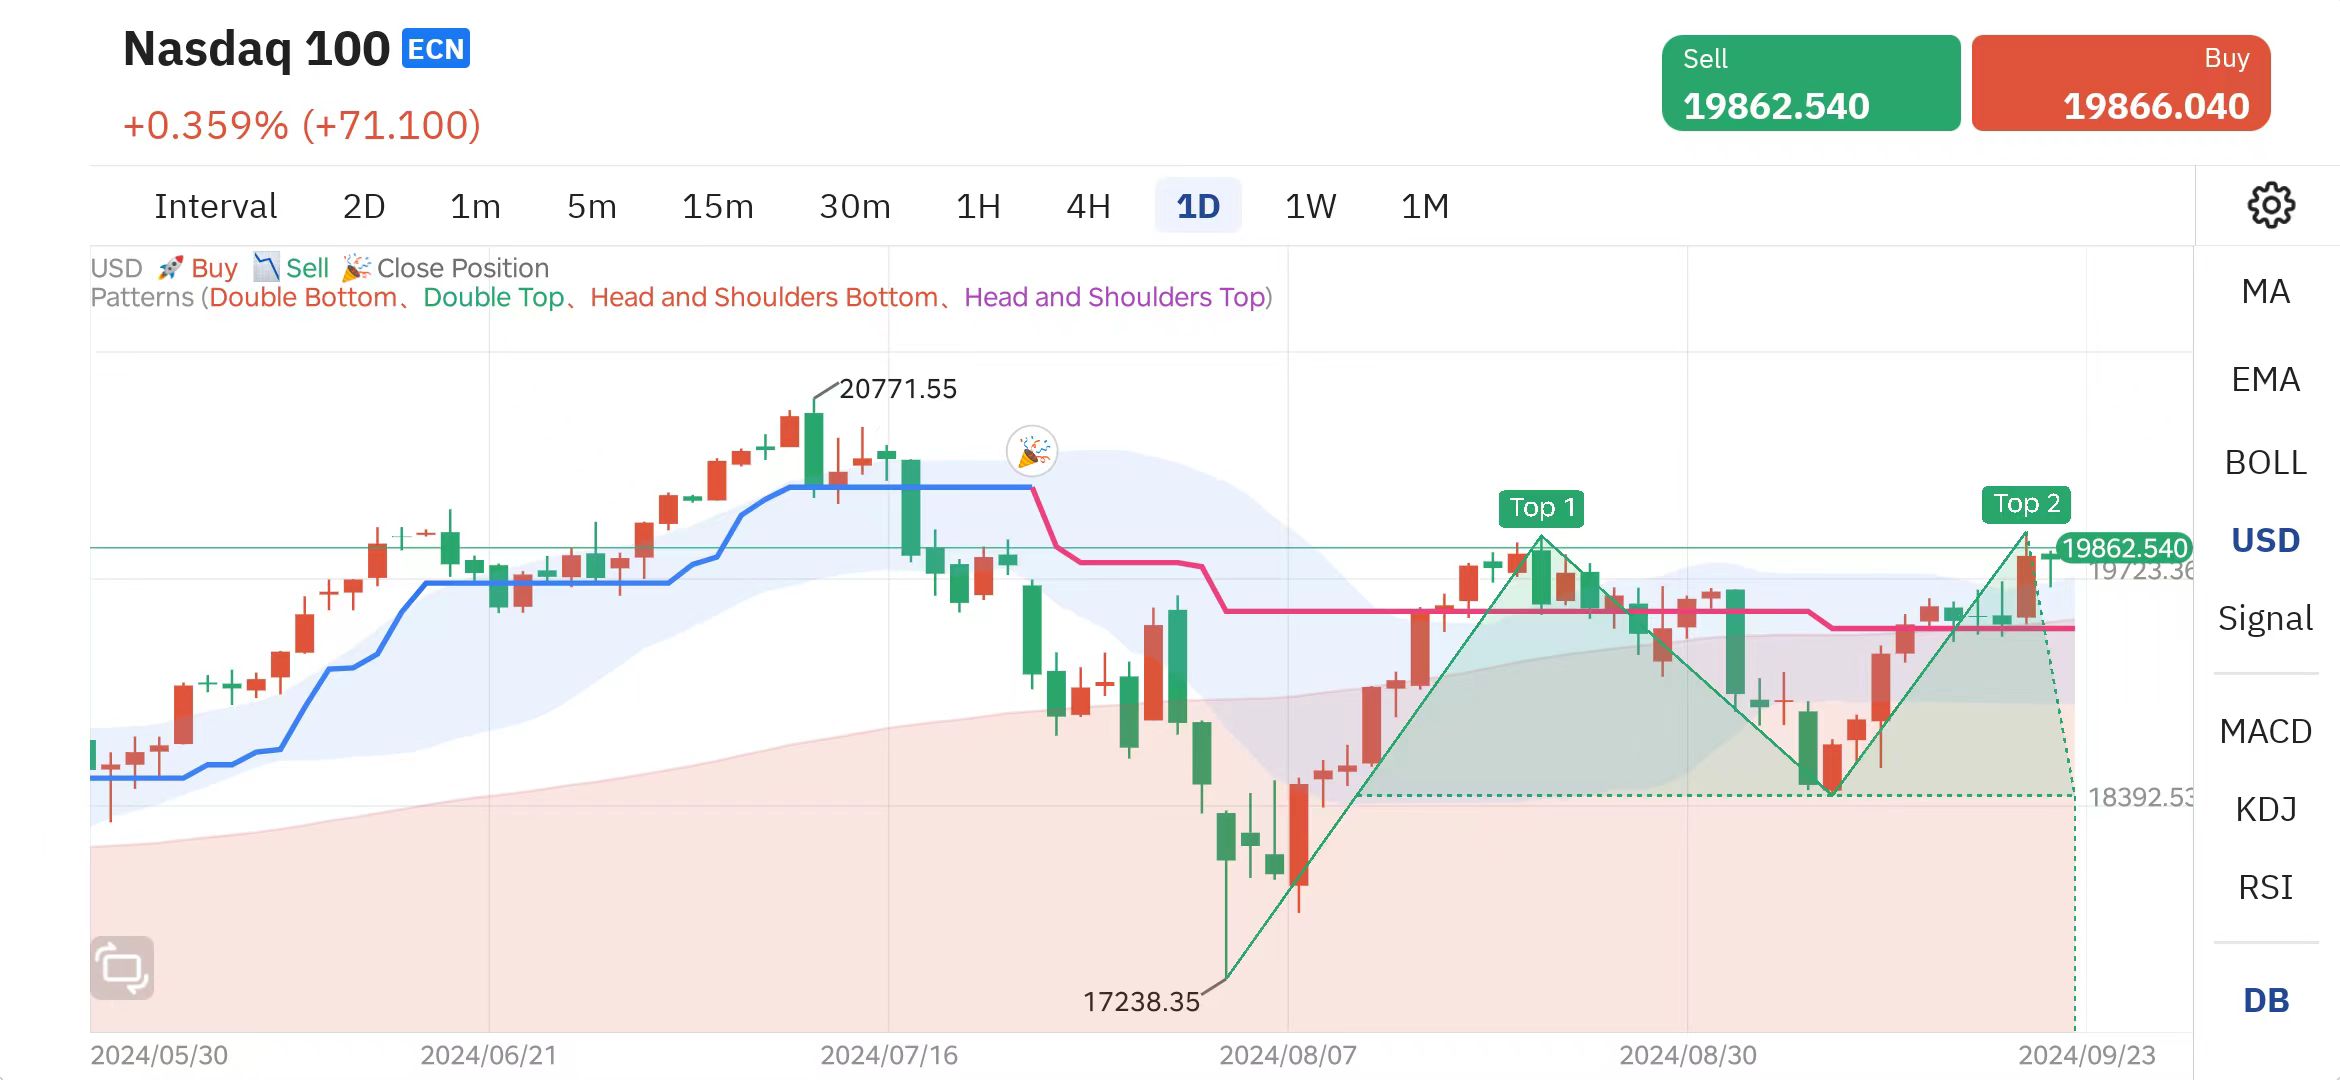
Nasdaq 100 (Daily Chart)
Analyzing the Nasdaq daily candlestick chart, the Nasdaq seems to be in the second top formation stage of Double Top Pattern. This pattern indicates that after a period of rise, the market has failed to continue to break through twice at similar highs. It may indicate that the upward momentum is weakening and there may be a downward trend in the future. In this technical pattern, investors usually look for opportunities to short.
In this process, 18350 points as the neckline and support level are particularly important. Once the price falls below this level, it may confirm the formation of a double top pattern and trigger a further decline. Therefore, this level is a key indicator for investors to decide whether to short.
In order to capture the key moments of the market more accurately, it is recommended that investors keep the Nasdaq pattern indicator turned on and consider setting the time period to 5 minutes. This short-term strategy helps to observe market dynamics more carefully, thereby maximizing investment returns.
In this process, smart assistants can play a key role in helping investors stay calm in every fluctuation of the market and ensure rational decisions in a complex and changing trading environment. With the support of intelligent tools, investors can face every challenge of the market with greater confidence.
Muat turun TOPONE Markets
Muat turun TOPONE Markets
Dapatkan isyarat dagangan yang paling menguntungkan dahulu, 1 juta pedagang telah memuat turunnya, dan purata peluang keuntungan harian melebihi 200!